Figure 3.

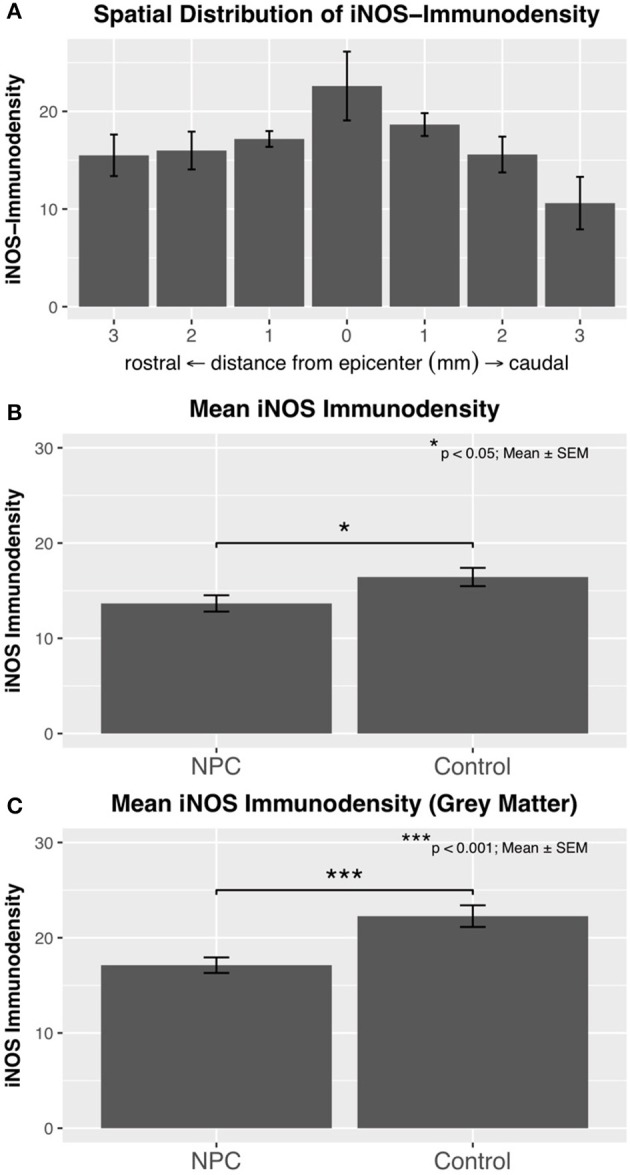
(A) Immunodensity of iNOS is in injured control animals (n = 6) maximal at the SCI epicenter with a gradual decline in intensity toward the periphery. (B) Mean iNOS immunodensity was significantly reduced in the NPC group compared to the control group, indicating a reduced pro-inflammatory M1 activation. (C) Immunodensity values for iNOS were especially high in the gray matter with a highly significant group difference in favor of the NPC group.
