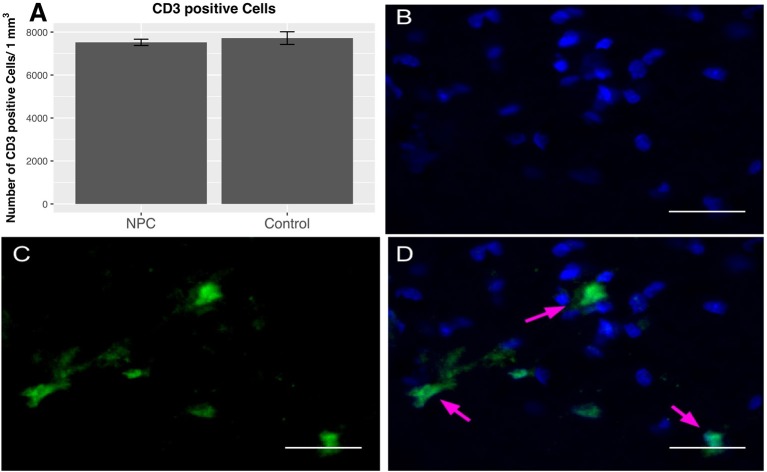
Figure 4.
Quantification of CD-3-positive T lymphocytes 8 weeks after SCI (n = 5). (A) No group differences in perilesional total T cell numbers were observed between NPC and control group. (B–D) Confocal fluorescence microscopy (40 × magnification, scale bar = 15 μm) of the injured spinal cord showing CD-3-positive T lymphocytes (green) co-expressing the nuclear cell marker DAPI (blue).

