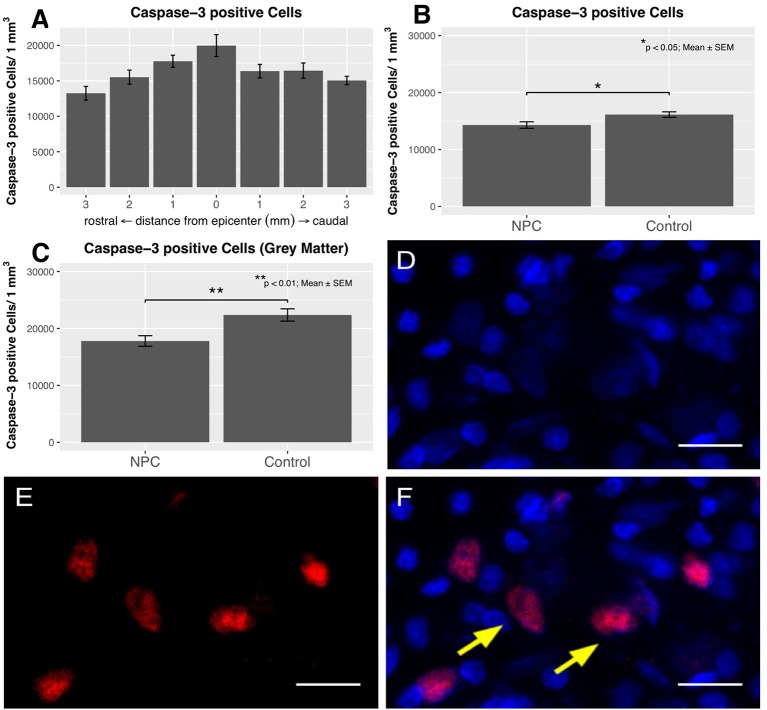
Figure 7.
The distribution of caspase-3-positive cells shows an accumulation of apoptotic cells at the epicenter in injured control animals with apoptotic cell numbers steadily decreasing toward the periphery (n = 6). (B) The quantification of caspase-3-positive cell numbers yields a significant reduction in the NPC group compared to the control group (n = 6–7). (C) Apoptotic cell counts were generally higher in the gray matter and were also significantly reduced in the NPC group compared to the control group. (D–F) Caspase-3-positive cells (red) with additional DAPI-expression (blue) were counted as apoptotic cells, as indicated by the yellow arrows (scale bars = 15 μm).

