
Figure 2.
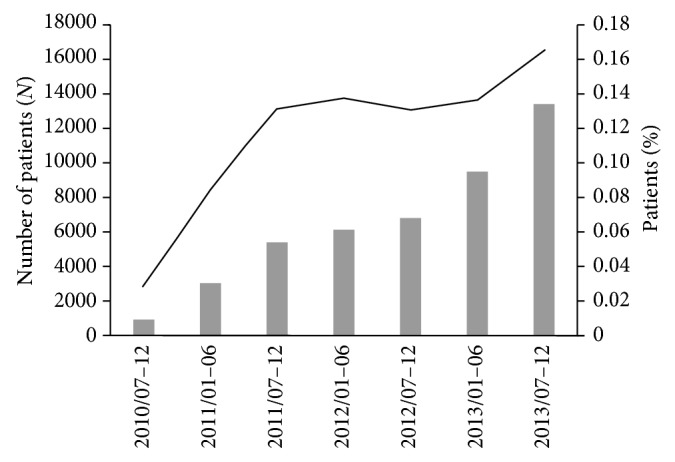
The number of patients newly prescribed pregabalin. Solid columns represent the number of patients newly prescribed pregabalin in each half year. Solid line represents the number of patients newly prescribed pregabalin in each half year divided by the total number of monthly patients in each half year in this database.