
Figure 1.
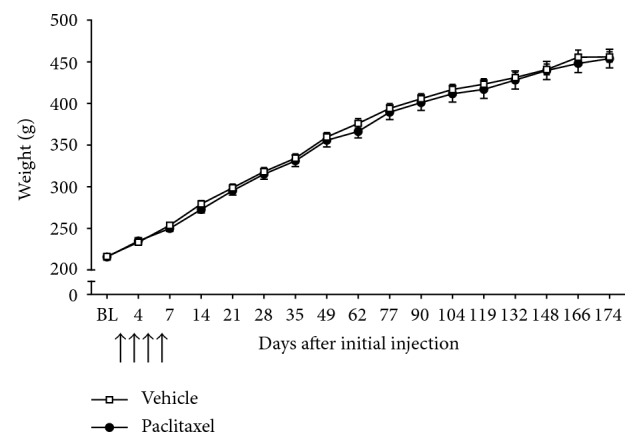
Time course of weight gain in rats following paclitaxel or vehicle administration. Graph shows mean ± SEM of rats' weight (g) from before paclitaxel/vehicle administration (BL) up to day 174. Arrows indicate four injections of 2 mg/kg paclitaxel or equivalent volume of vehicle on days 0, 2, 4, and 6 (n=18 per group).