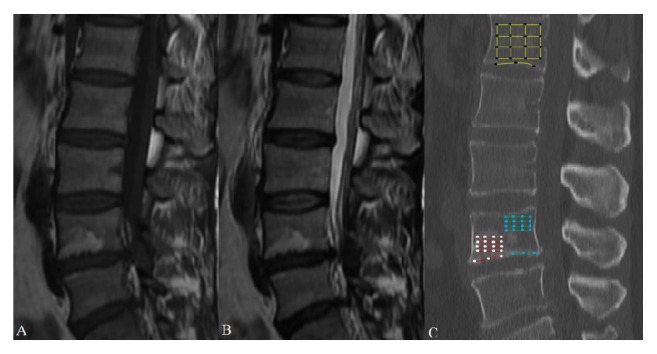
Figure 1.

Quantitative measurements for the CT values of bone marrow area. According to the sagittal MRI plane (A for T1W, B for T2W), the same sagittal reconstructed CT scans (C) were localized on the PACS. A rectangular region of interest (ROI) as large as possible was drawn within the MC regions (red), adjacent non-MC regions (green), and L1 vertebra (yellow), which represented each bone marrow area. Points of trisection on each side were marked and connected to the opposite. The mean CT value of each group of intersection points was calculated (MCs, white; non-MCs, blue; L1 vertebra, black). A line was drawn along the endplate, and the points of trisection were marked. The mean CT value of each group of points was obtained (MCs, white; non-MCs, blue; L1 vertebra, black).
