. 2016 Jan 7;7(6):3602–3613. doi: 10.1039/c5sc03886c

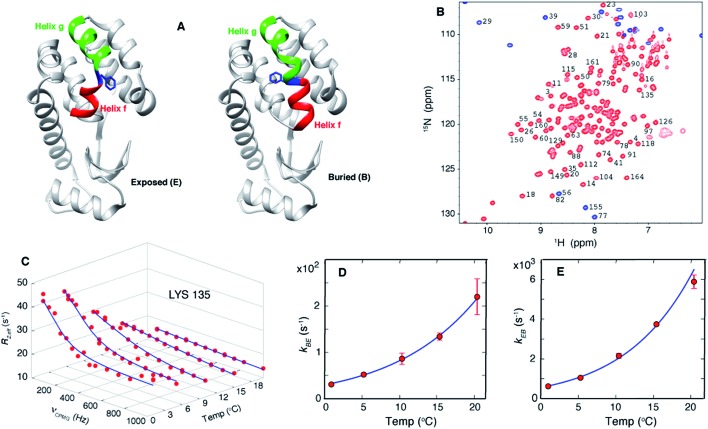
Fig. 1. Exchange between E and B conformers of T4L L99A can be quantified using CPMG RD NMR. (A) E and B structures of T4L L99A, as established from X-ray37,40 and CPMG RD NMR33 studies. Helices f (residues 107–113) and g (115–123) are colored in red and green respectively, with Phe 114 shown in blue. (B) 15N-1H HSQC spectrum98 of T4L L99A, G113A, R119P recorded at 35 °C, 11.7 T, with assignments of selected peaks. Peaks aliased in the 15N dimension are shown in blue. (C) Amide 15N CPMG RD profiles of Lys135 recorded at 1, 5.3, 10.4, 15.4 and 20.4 °C, 11.7 T. Red dots are the measured R2,eff rates and the blue line is from a global best-fit to the experimental data. (D, E) Arrhenius plots of kBE and kEB obtained from analysis of the CPMG data. Experimental rates are shown as red circles and the best-fit Arrhenius curves are in blue (see ESI, Arrhenius analysis of the temperature-dependent rate constants kBE and kEB).

Fig. 1