. 2016 Jan 7;7(6):3602–3613. doi: 10.1039/c5sc03886c

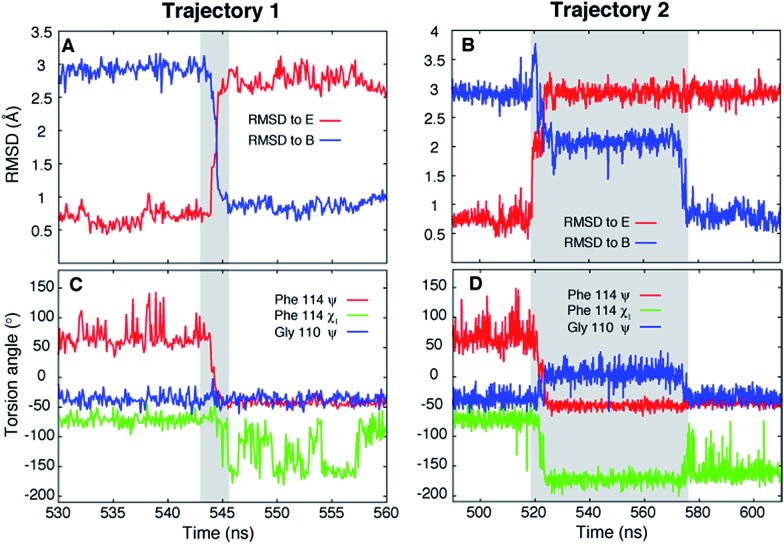
Fig. 2. Unbiased MD simulations, 37 °C, capture the T4Ltm E to B transition. (A, B) RMSD to the E (3DMV (ref. 40)) and B (see ESI, details of the MD simulations) states as a function of time for two trajectories that capture the E to B transition. The trajectories start in the E state and finish in the B state. The N, Cα, carbonyl C and O atoms of residues 100 to 120 and all heavy atoms in Phe114 and Leu133 were used to calculate RMSD values. (C, D) Variation of Phe114 ψ, χ1 and Gly110 ψ torsion angles as a function of time. The intervals during which a molecule transitions from E to B are shown in grey. Movies showing the E to B transitions for trajectories 1 and 2 are available in the ESI. .

Fig. 2