. 2016 Jan 7;7(6):3602–3613. doi: 10.1039/c5sc03886c

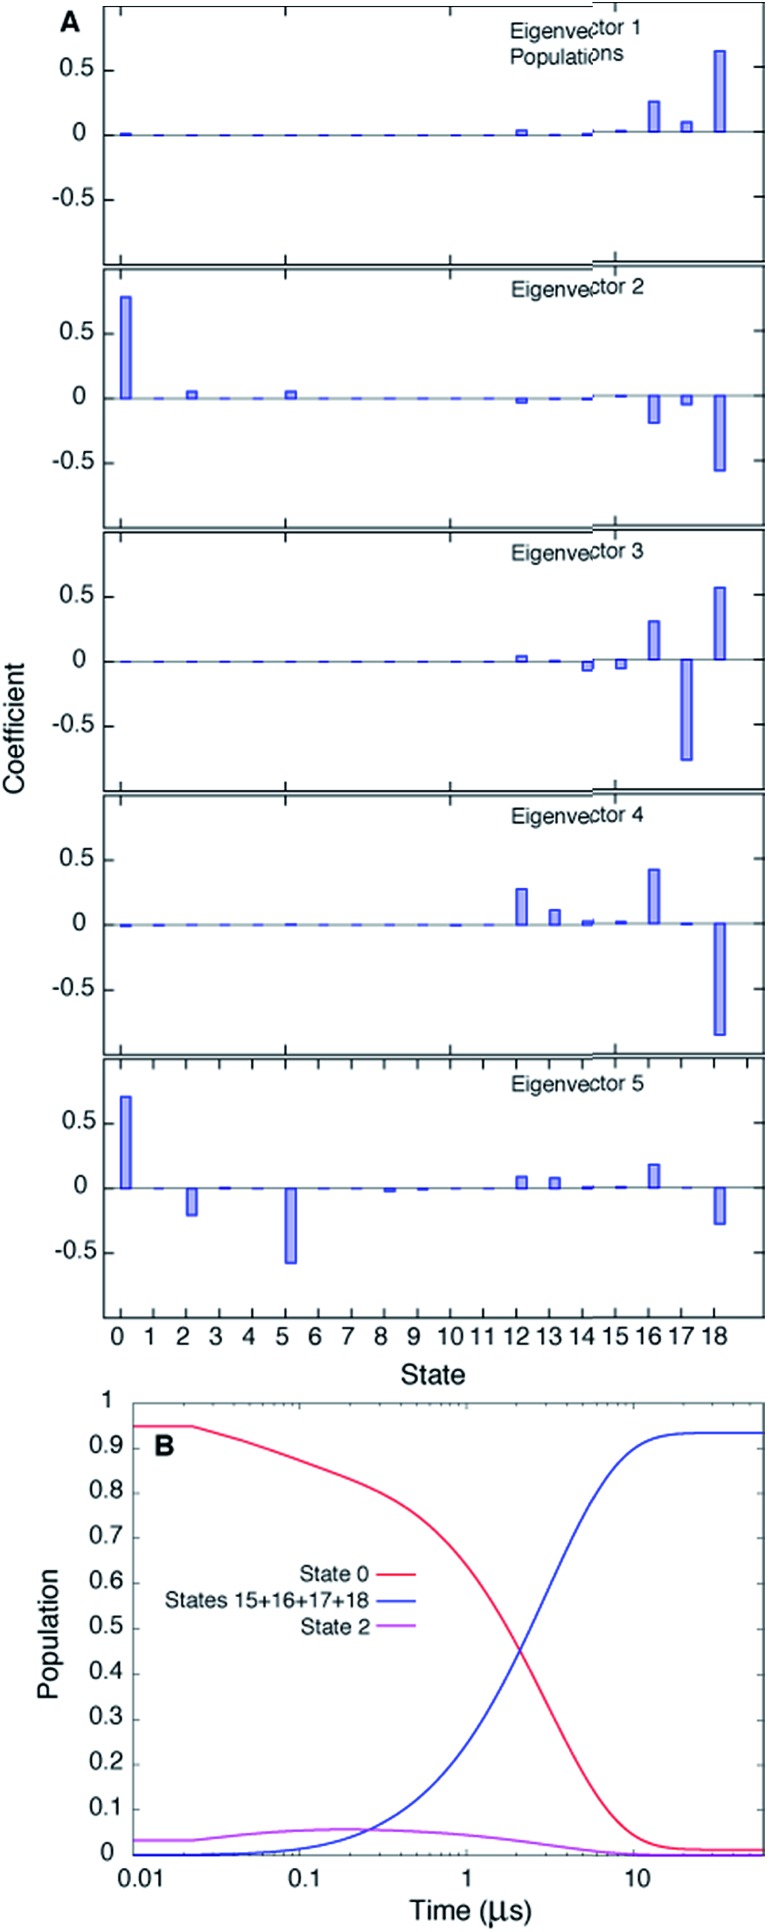
Fig. 3. The slowest process detected in the MSM analysis of the MD simulations of T4Ltm, 37 °C, corresponds to the E to B interconversion. (A) The first five eigenvectors of the 19-state MSM. The states are ordered according to their committor (Table S1), that is the probability of reaching B before E. States 8 and 9 are transition states with committor values ∼0.5. The first eigenvector gives the steady state populations of each of the 19 macrostates and the next four correspond to the four slowest implied timescales. The second mode (eigenvector 2) reports the exchange between B and E states of T4Ltm that can be seen from the fact that the state space is partitioned into states 0 and 16–18 that in turn correspond to E and B, respectively. (B) Time evolution of the population of state 0 and the sum of the populations of states 15–18, starting from an initial population of state 0 of 1, while all the other states are not populated. The system is evolved using the transition matrix at τ = 22.5 ns according to the relation P() = P(0)T(τ)n, where P(0) is a population vector with the first element 1 and all other elements 0. The population of state 0 decreases along with a concomitant increase in the sum of the populations of states 15–18, with a time constant of ∼3 μs that corresponds to the slowest process observed. The population of state 2 transiently goes up and comes down.

Fig. 3