. 2016 Jan 7;7(6):3602–3613. doi: 10.1039/c5sc03886c

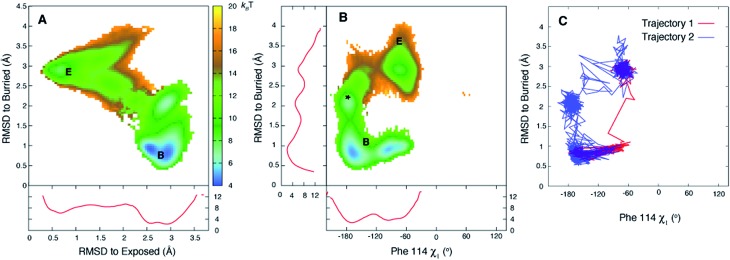
Fig. 4. The free energy surface is rugged over the small length scale that separates states E and B. (A, B) Free energy surfaces calculated at 37 °C using the 19-state MSM. Three minima are observed for state B (middle panel) corresponding to the χ1 torsion angle of Phe114 populating different rotamer states, with the trans conformation the predominant one (see Fig. S7). Notably minima other than for B and E are observed as well (*). Red curves in panels (A) and (B) correspond to 1D PMF surfaces, corresponding to projections of 2D energy surfaces onto a single axis. (C) The E to B transition can occur via different pathways as illustrated for trajectories 1 and 2 of Fig. 2, showing that the molecule in trajectory 2 becomes trapped in the minimum labeled by * in (B). Atomic coordinates for the reference B state structure are available in the ESI. .

Fig. 4