. 2016 Jan 7;7(6):3602–3613. doi: 10.1039/c5sc03886c

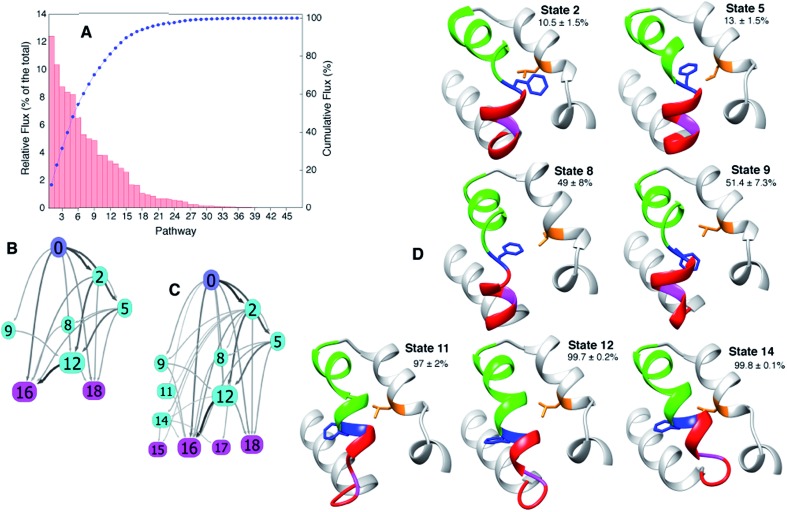
Fig. 5. The paths connecting E to B involve different intermediates. (A) Relative contribution of each of the 47 pathways calculated from the MSM to the total flux, 37 °C. (B, C) The most important 11 and 22 pathways are shown in (B and C), respectively, with the arrows shaded according to the flux between each pair of states. (D) Dominant intermediates in the E to B interconversion reaction. Residues 94 to 140 of T4Ltm are shown in ribbon format: helix f in red, helix g in green, Gly 110 in magenta, Phe 114 in blue and Leu 133 in orange. Sidechains of Phe 114 and Leu 133 are indicated and the committor values for the E to B transition listed as percentages. Atomic coordinates of five randomly chosen structures from each of the 19 states are available in the ESI. .

Fig. 5