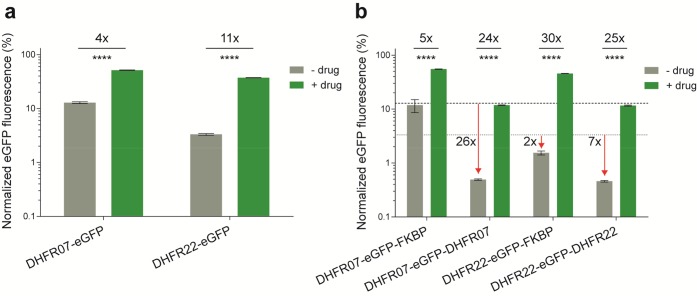
Figure 3.
Quantitative assessment of the background levels and inducibility of DHFR-DD variants in Drosophila S2R+ cells that are optimized for room temperature.28 (a) Histogram showing the normalized mean eGFP fluorescence for the DHFR-DD variants 07 and 22 in mock-treatments with DMSO (−) and the presence (+) of 100 μM TMP. (b) Histogram showing the normalized mean eGFP fluorescence for the double architectures derived from the parent DHFR-DD variants 07 and 22, and with FKBP-DD. The horizontal lines indicate the mean eGFP fluorescence of parent DHFR-22 (dot) and DHFR-07 (hyphen) DDs in the absence of drug. The error bars represent the standard deviation over the mean across the 5 biological replicates. Other labels are as for Figure 1.

