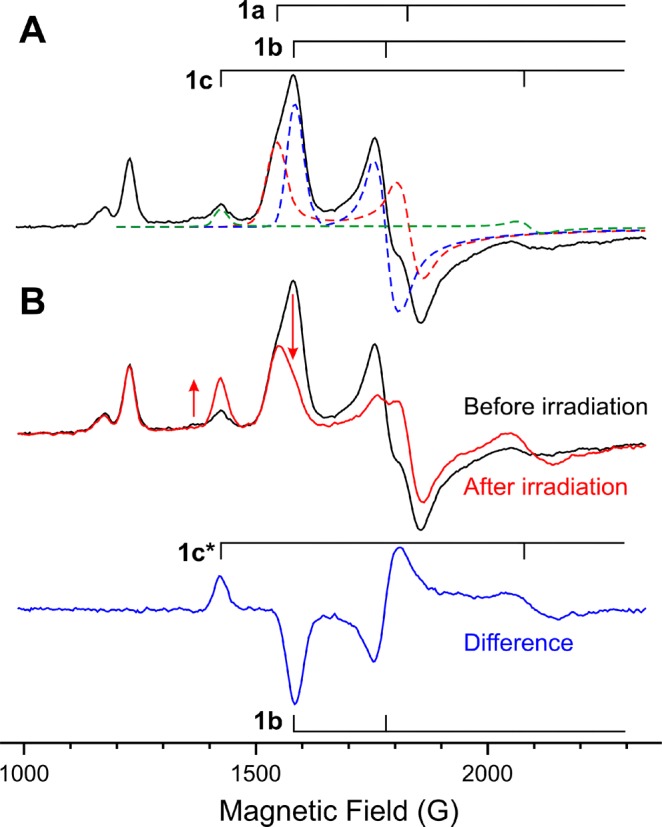
Figure 3.

(A) EPR spectrum of WT argon turnover in H2O with the shown decomposition into the three signals 1a, 1b, and 1c. (B) Changes in the EPR spectrum after 20 min of irradiation of the sample with 450 nm laser-diode light at 4 K. The lower trace is the difference of spectra before and after irradiation, and it shows only 1b and 1c* EPR features. Nonphotolabile species with EPR signals around 1200 G were previously suggested to come from an oxidized P-cluster in the S = 7/2 state.24
