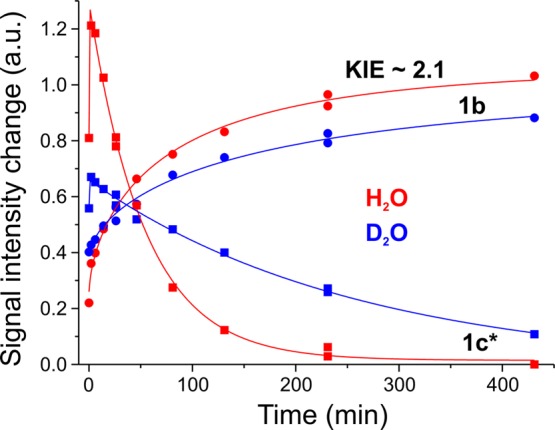
Figure 5.

Progress curves of the EPR signals 1b and 1c* during 145 K cryoannealing of photolyzed WT Ar turnover samples in H2O and D2O. Recoveries of the 1b signal are fitted as stretched exponentials with m = 0.65 and τ = 83 min for H2O and τ = 174 min for D2O. Solid lines showing changes of the 1c* signal are guides for the eye.
