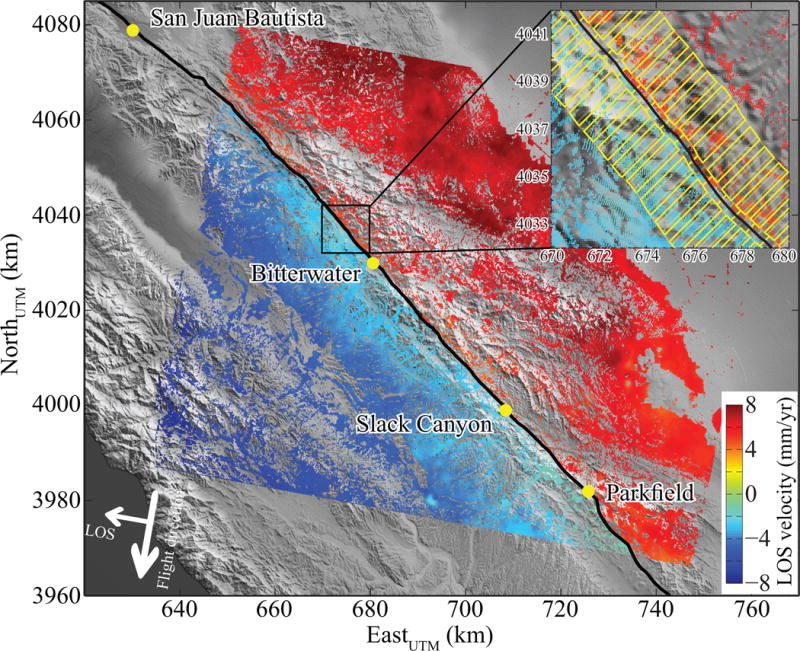
Fig. 1. Creeping segment of the San Andreas Fault with long-term InSAR LOS velocity20,25.

The trace of the SAF is shown with the black line. Warm and cold colors correspond, respectively, to the movement toward and away from the descending satellite. The inset depicts the moving window used for estimation of near-field creep rate, with every other step shown with a lower opacity for visualization purposes. Shaded relief topography is digital train model from Shuttle Radar Topography Mission.
