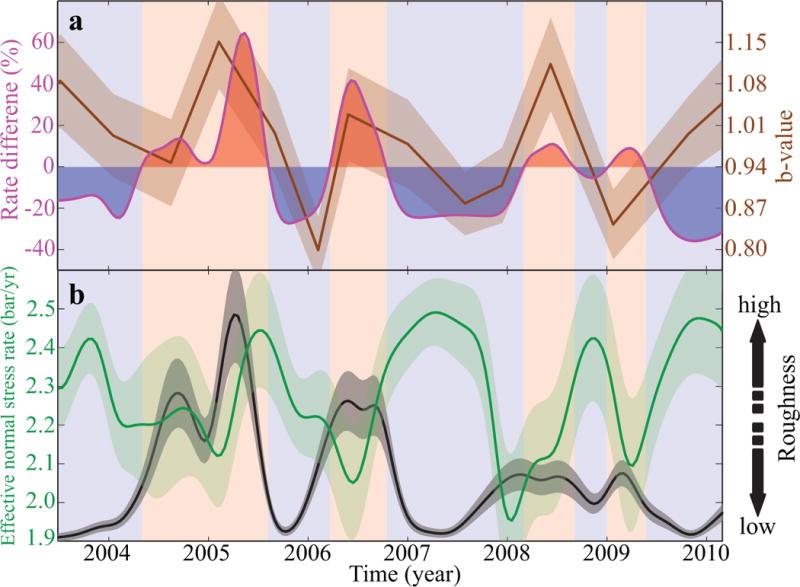
Fig. 3. Temporal evolution of creep rate, effective normal stressing rate, roughness, and b-value.

a, Time series of spatially averaged LOS creep rate difference in percentage (magenta), and b-value (brown) alongside its one-sigma uncertainty (shaded brown). Background red and blue bands highlight the time interval of SSEs and decelerated creeping, respectively. b, Temporal evolution of spatially averaged effective normal stress rate (green) and its standard deviation (shaded green), and roughness amplitude of LOS creep rate difference along the fault (black) and its one-sigma uncertainty (shaded gray). All the curves in this figure, beside the b-value are smoothed using a Gaussian smoothing filter with a window size of 6 months.
