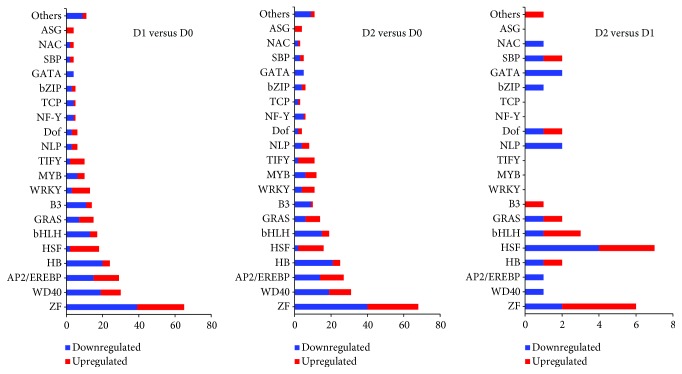
Figure 5.
Distribution of differentially expressed TFs in recalcitrant tea seeds during dehydration treatment. The histograms show the number of downregulated and upregulated TFs in D1 versus D0, D2 versus D0, and D2 versus D1 libraries, respectively. Details are not shown for TF gene families with less than four unigenes.

