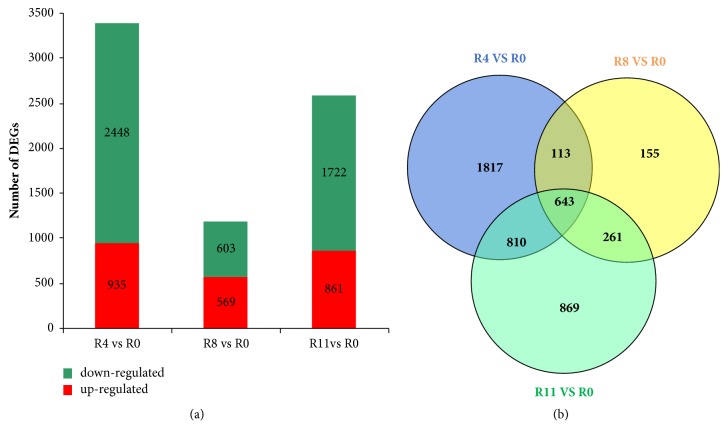
Figure 2.
Large number of DEGs were induced by B. pseudomallei infection. (a) The graph showed the upregulated and downregulated DEGs from R4 versus R0, R8 versus R0, and R11 versus R0 comparisons, respectively. (b) The Venn diagram presented the number of DEGs from R4 versus R0, R8 versus R0, and R11 versus R0 comparisons.

