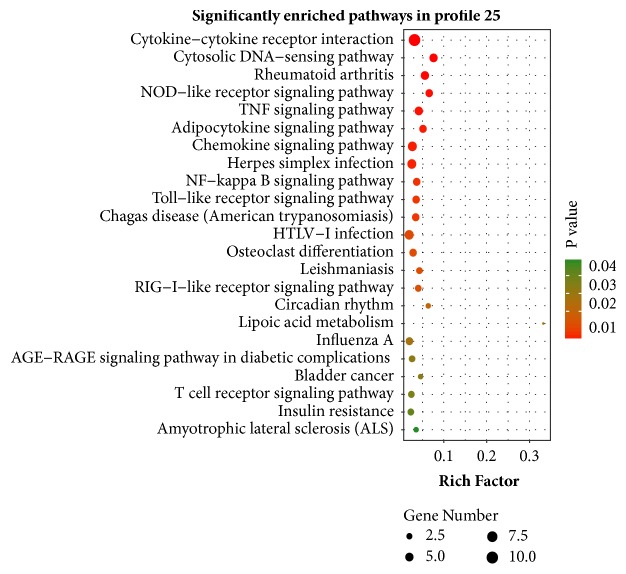
Figure 4.
KEGG pathway enrichment analysis of DEGs in profile 25. Y-axis represented pathways, and X-axis represented rich factor (rich factor = the number of DEGs enriched in a pathway/the number of all genes annotated to the pathway).Color and size of each bubble represented enrichment significance and amount of DEGs enriched in a pathway, respectively.

