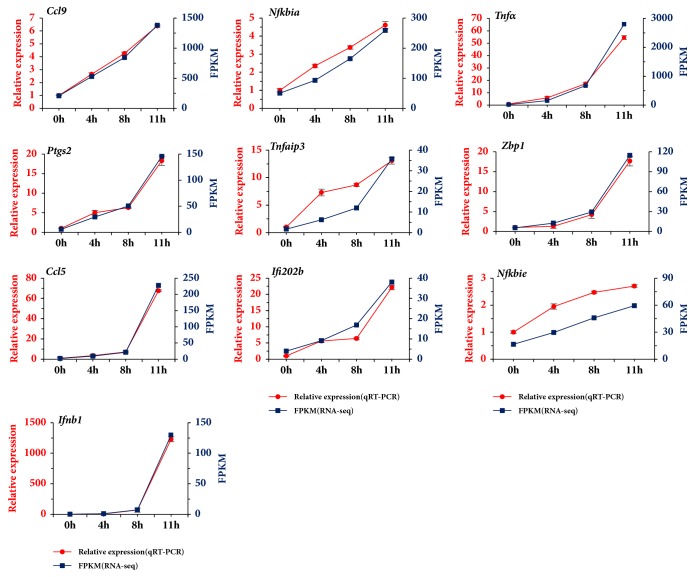
Figure 5.
Validation of 10 DEGs by qRT-PCR. X-axis represented different time points postinfection. The left Y-axis represented the relative mRNA expression level of the DEGs by qRT-PCR, while the right Y-axis represented the FPKM of the DEGs from RNA-Seq. Data from qRT-PCR were means of three independent replicates and bars represented SD.

