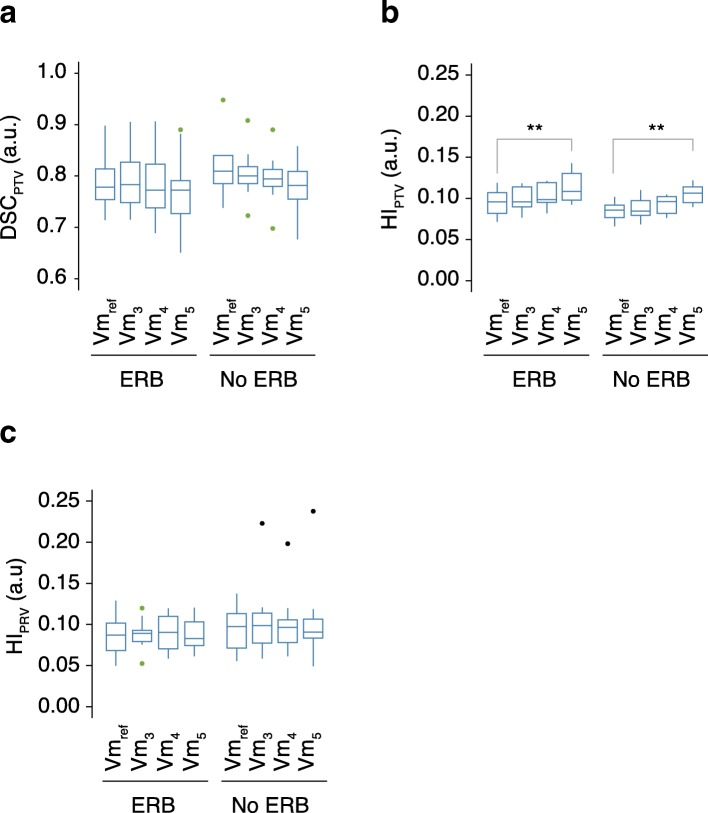
Fig. 3.
Box-and-whisker plots of (A) DSCPTV, (B) HIPTV and (C) HIuPRV with ERB and without ERB for Vmref, Vm3, Vm4, and Vm5. Outliers are visible with green dots for out-values (1.5xIQR) and black dots for extreme out-values (3xIQR). Significant relations are shown with gray lines above the boxplots. * is set for P < 0.05 and ** for P < 0.005

