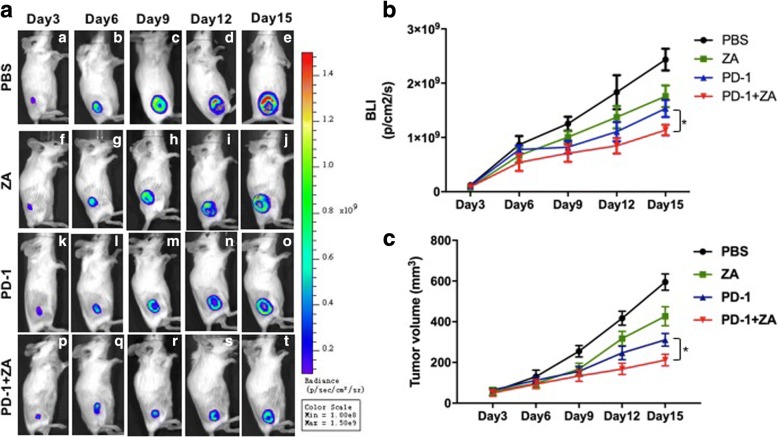
Fig. 1.
Representative BLI and tumor volume after different treatments for 12 continuous days. a. The typical BLI images of each group after different treatments; b. Quantification of the BLI signal of tumors after different treatments; c. Tumor volume measurement at different time points. The data are presented as the means ± SEM (* p < 0.05)

