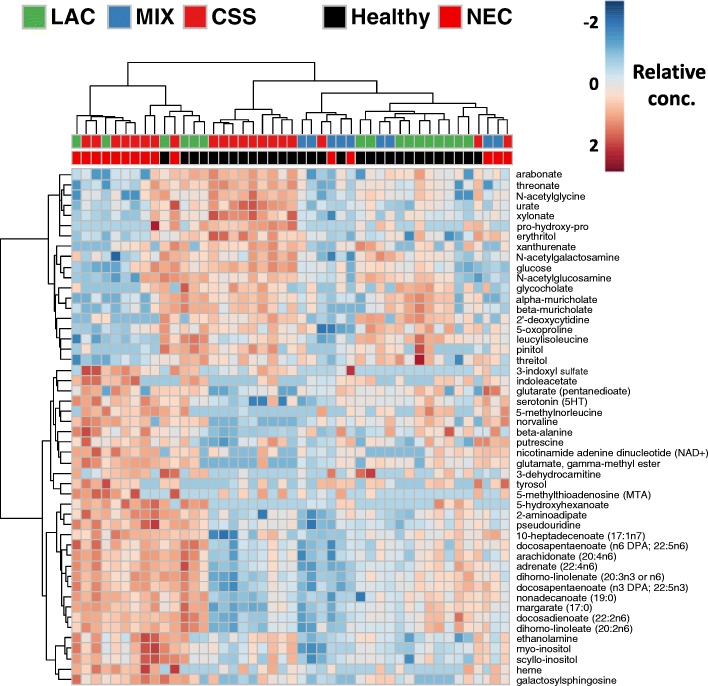
Fig. 5.
Heatmap of cecal contents metabolite profiles clustered by formula carbohydrate and disease phenotype. Shows the relative concentration of the top 50 metabolites with the largest differences between healthy and NEC piglets. All metabolites included are significantly different (FDR-adjusted q < 0.05) between healthy and NEC by two-way ANOVA (formula group × disease phenotype)

