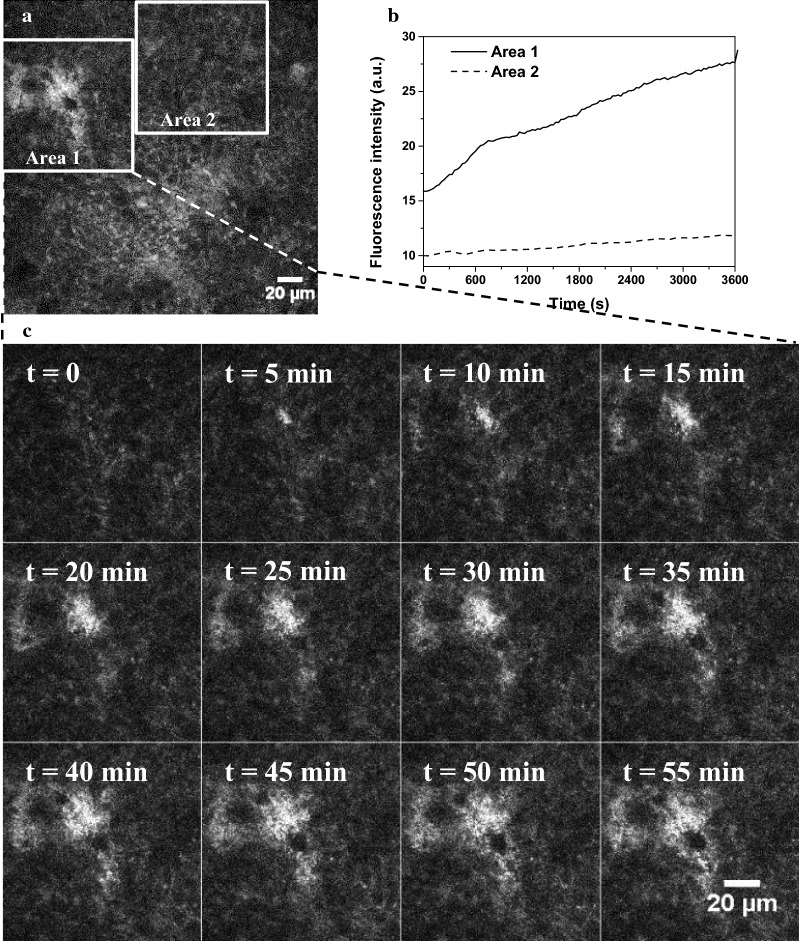
Fig. 2.
a Fluorescence intensity image of HT29-MTX cells in the presence of food-grade E171 particles recorded 18 µm above the substratum 1 h after particle injection. b Evolution of fluorescence intensity over time inside two distinct areas identified by white rectangles in the previous image. c Fluorescence intensity image sequence over time in area 1 from injection of food-grade E171 to 1 h after. λexc = 364 nm. λem = 400–700 nm

