
Fig. 4.
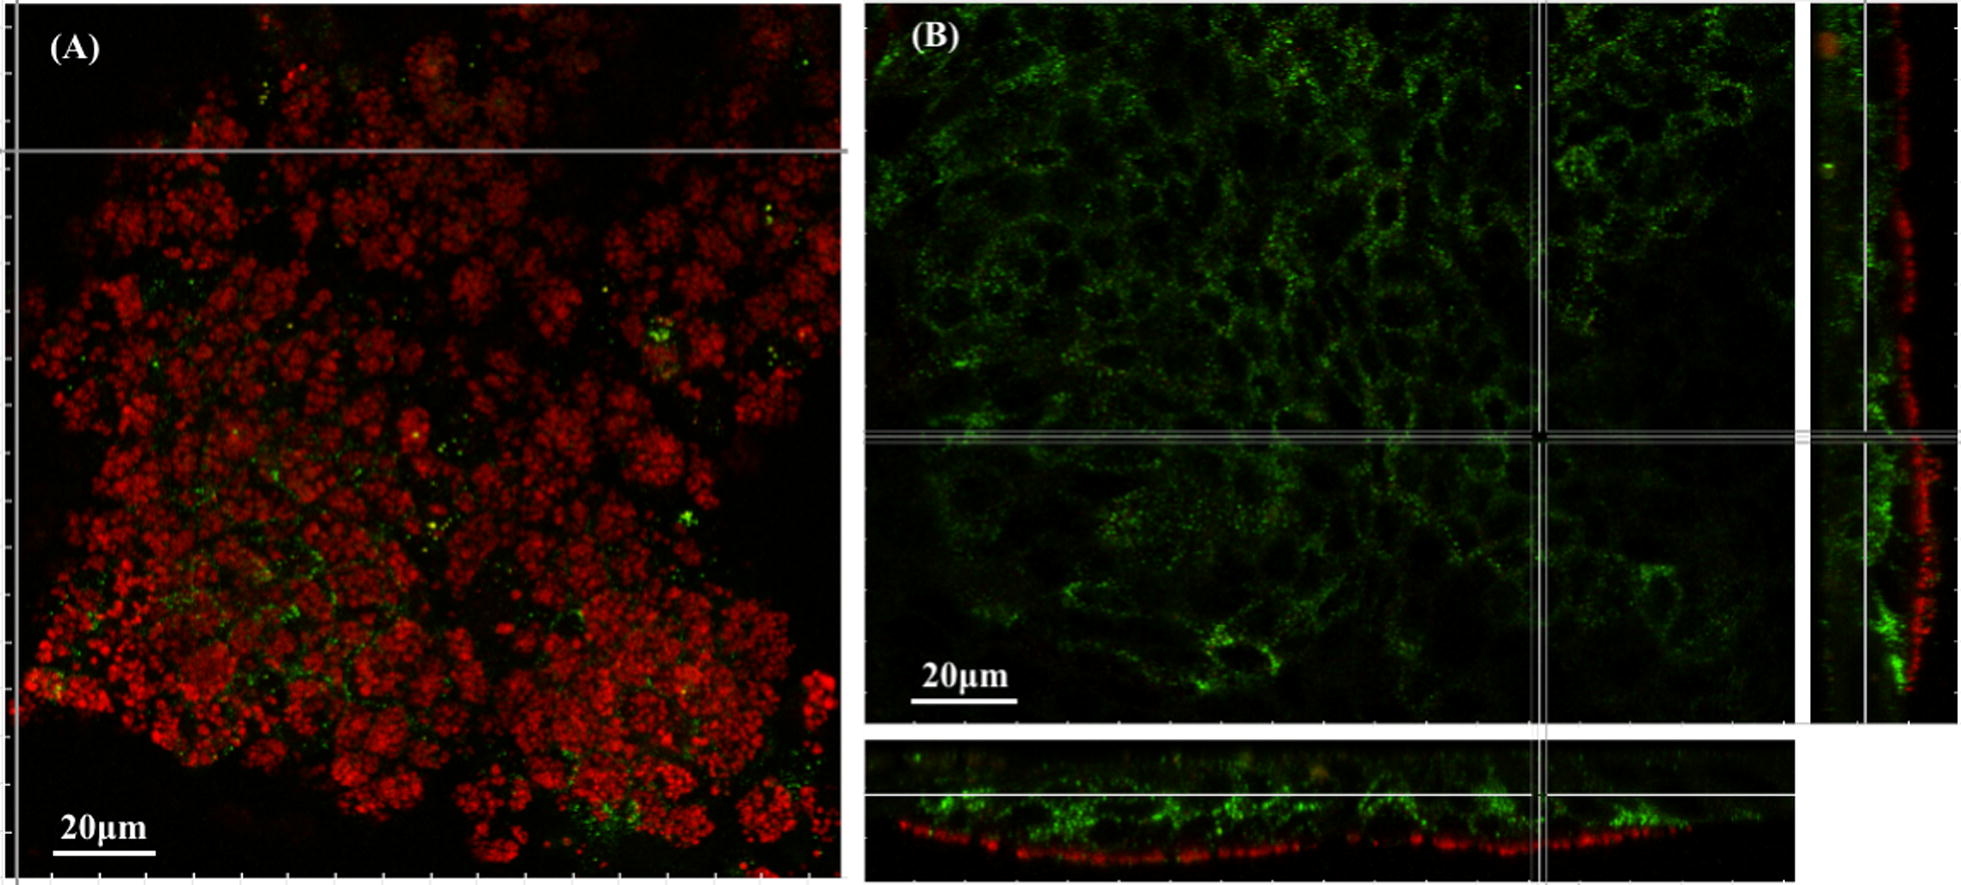
MUC5AC immunofluorescence staining of the HT29-MTX cell line. Representative confocal laser scanning microscopy z-stack image of MUC5AC (in red) produced by HT29-MTX cells (E-cadherin, in green) cultured under standard conditions. A z-stack section (x, y) at the level of the mucus; B z-stack section (x, y) at the level of HT29-MTX cells with orthogonal x (y, z) and y (x, z) sections on the right and bottom, respectively. The image was prepared using the easy 3D section view of IMARIS software with extended view (signal gathered from a thickness of 5 µm)