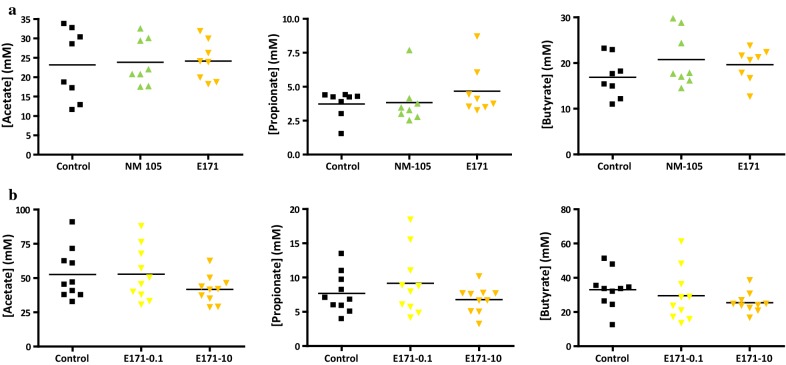
Fig. 5.
Effect of TiO2 exposure in rats on the cecal composition of acetate, propionate, and butyrate after (a) a 7-day treatment (black: control; light green: NM-105 10 mg/kg bw/day; light orange: E171 10 mg/kg bw/day) and (b) a 60-day treatment (black: control; yellow: E171 0.1 mg/kg bw/day; light orange: E171 10 mg/kg bw/day). Points are from individual rats and bars represent the mean. Statistical significance, assessed using GraphPad Prism 4 software, was determined by one-way ANOVA followed by post hoc tests. Significance was set at a p value < 0.05

