Fig. 7.
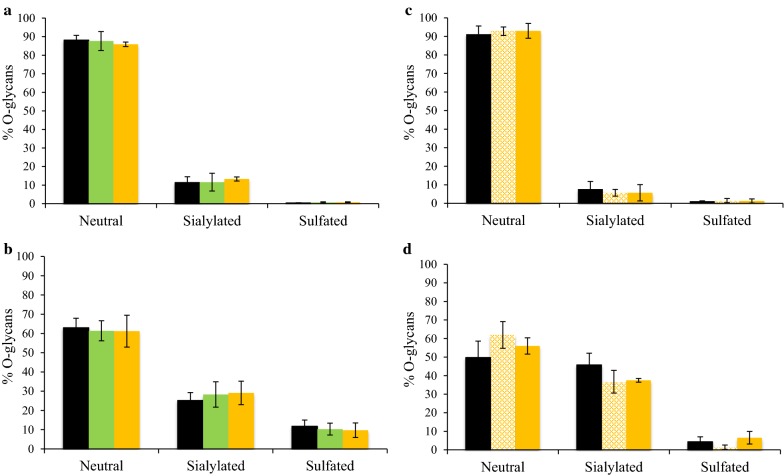
Effect of TiO2 exposure in rats on the relative percent of neutral, sialylated, and sulfated mucin O-glycans after (a, b) a 7-day treatment (black: control; light green: NM-105 10 mg/kg bw/day; light orange: E171 10 mg/kg bw/day) and (c, d) a 60-day treatment (black: control; light orange hatched: E171 0.1 mg/kg bw/day; light orange: E171 10 mg/kg bw/day) in (a, c) small intestine (a: ileum; c: jejunum) and (b, d) distal colon. The results shown are average values and standard deviations for three pools of three to four samples for each condition

