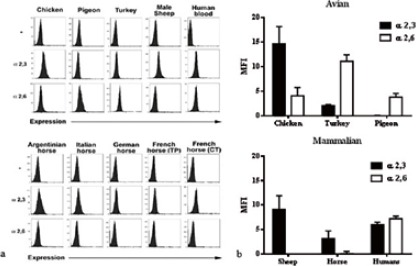
Fig. 1.

Expression of SA α 2,3 and α 2,6 Gal linkages in erythrocytes from avian (turkey, chicken, pigeon) and mammalian (sheep, horse, humans) species. Data originated from replicates of the same samples. a) Erythrocytes were incubated with DIG-labeled SNA (α 2,6 Gal linkage), DIG-labelled MAA (α 2,3 Gal linkage) or without lectins (-) and subsequently incubated with anti-digoxigenin antibody conjugated with fluorescein. Cells were analysed by flow cytometry and the results were expressed as the log10 relative fluorescence versus number of cells. The graphs show the Mean Fluorescence Intensity (MFI). Data are presented as mean ± SD (n ≥ 2). Representative histograms are shown. b) Distribution of α 2,3 and α 2,6 Gal linkages among animal species. The graphs show the MFI. Data are presented as mean ± SD (n ≥ 2).
