Figure 3.
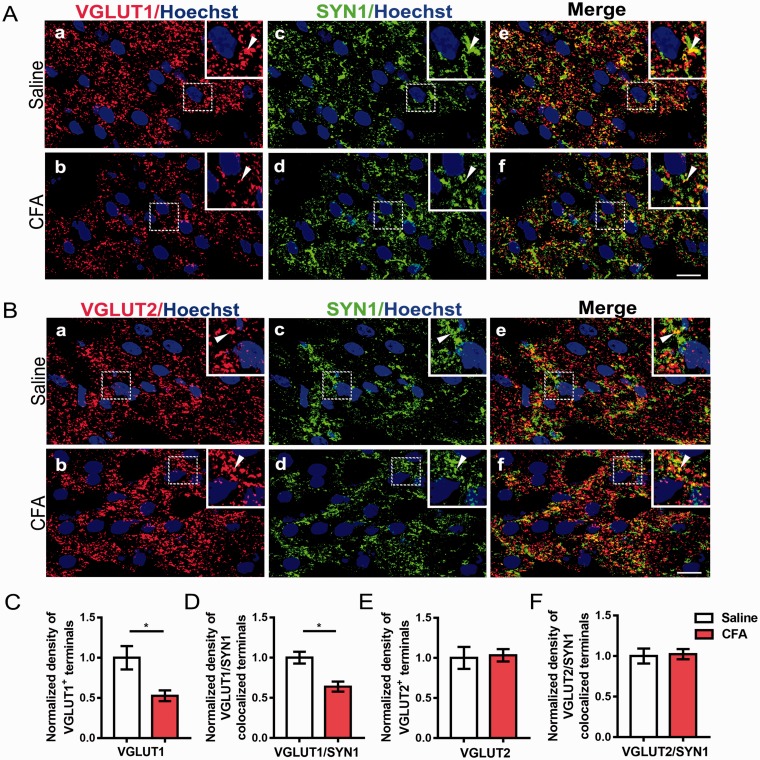
The presynaptic expressions of VGLUT1 in the NAc were decreased. (A) Double immunostaining for VGLUT1 (red, (a) and (b)) and SYN1 (green, (c) and (d)) in axon terminals in the NAc. (e) and (f) are merged figures of (a) and (c), and of (b) and (d), respectively. Insets are enlarged image of dashed areas in each figure. Arrowheads indicate VGLUT1 and SYN1-colocalized terminals. (B) Double immunostaining for VGLUT2 (red, (a) and (b)) and SYN1 (green, (c) and (d)) in axon terminals in the NAc. (e) and (f) are merged figures of (a) and (c), and of (b) and (d), respectively. Insets are enlarged image of dashed areas in each figure. Arrowheads indicate VGLUT2 and SYN1-colocalized terminals. (C and D) Quantitative analysis revealed that the immunostaining density of VGLUT1-positive terminals and VGLUT1/SYN1 coexisted terminals was decreased in the CFA group compared with saline group. (E and F) Quantitative analysis revealed that the immunostaining density of VGLUT2-positive and VGLUT2/SYN1-double-positive terminals was unaltered in the CFA group compared with saline group. Scale bar = 10 µm. The data are presented as the means ± SEM (n = 5/group *p < 0.05, compared to the saline group).
VGLUT: vesicular glutamate transporters; NAc: nucleus accumbens; SYN1: Synaptophysin 1; CFA: complete Freund’s adjuvant; SEM: standard error of mean.

