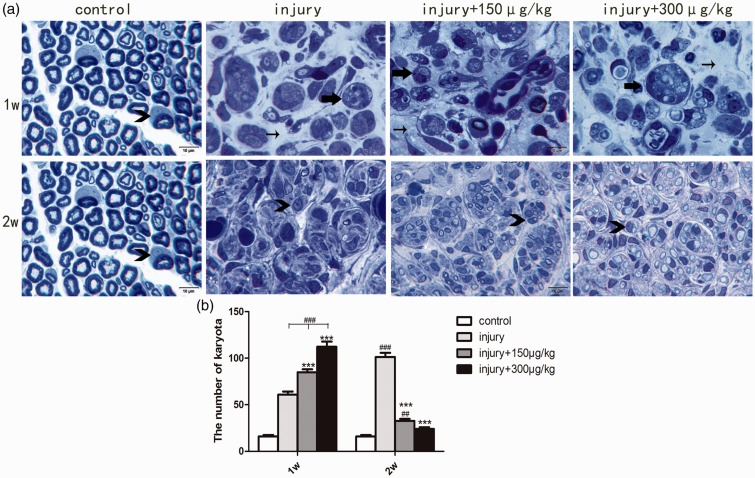
Figure 4.
Semithin transverse sections of sciatic nerves and karyocyte quantification analysis. (a) Observation of the sciatic transverse sections in each group. (b) Statistical graph for the number of karyota in each group.  ##p<0.01 compared to the control group, ###p<0.001 compared to the control group, *** p< 0.001 compared to the injury-only groups.
  the macrophages,
  the Schwann cells,
  the interstitial tissue, Scale bar = 10 μm.

