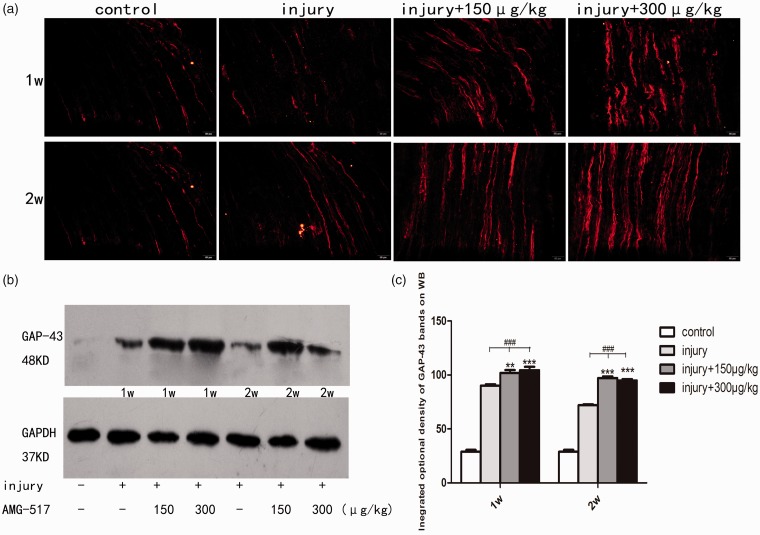
Figure 6.
Immunofluorescence and Western blot for GAP-43. (a) Immunofluorescence of longitudinal section of sciatic nerve in each group. The red fluorescence represents GAP-43-positive fibers. (b) Bands of Western blot for GAP-43. (c) The statistical graph for integrated optical density of Western blot bands (###p<0.01 compared to the control group, **p<0.01 compared to the injury-only groups, ***p < 0.001, compared to the injury-only groups; Scale bar = 50 μm).

