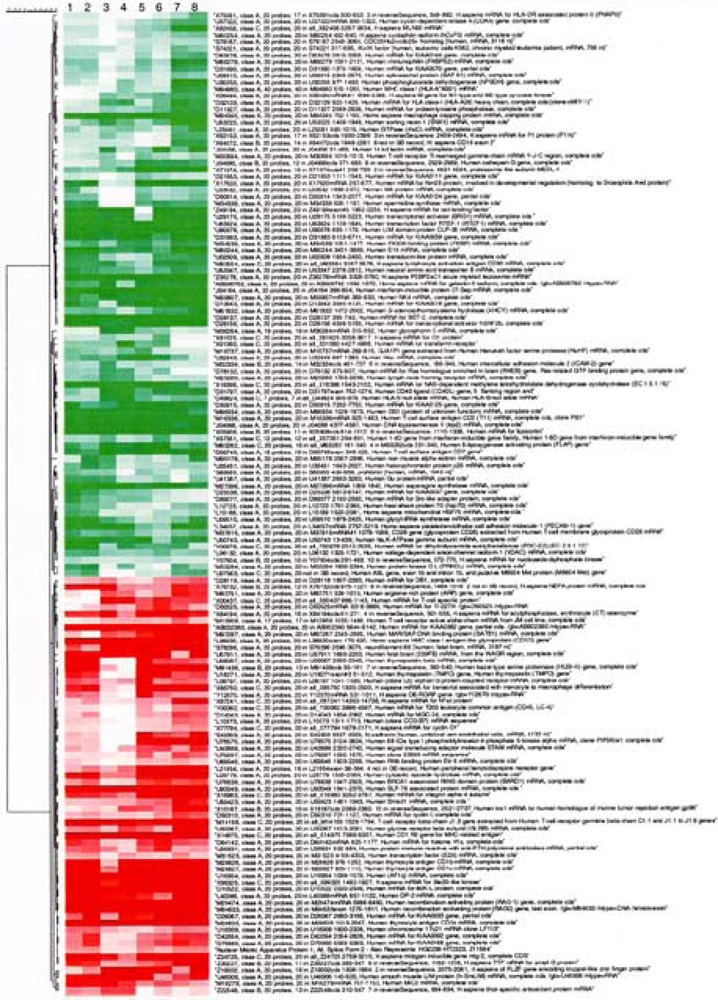
Figure 2.

Cluster analysis of changes in gene expression levels in Jurkat-PBR versus Jurkat-pHβ cells. The degree of redness and greenness represents induction and repression, respectively. Comparisons 1–4 and 5–8 correspond to two independent experiments, respectively. In each experiment, two samples are analyzed in duplicate. Hierarchical clustering was applied to modulated genes selected as described in the Materials and Methods section.
