
Figure 1.
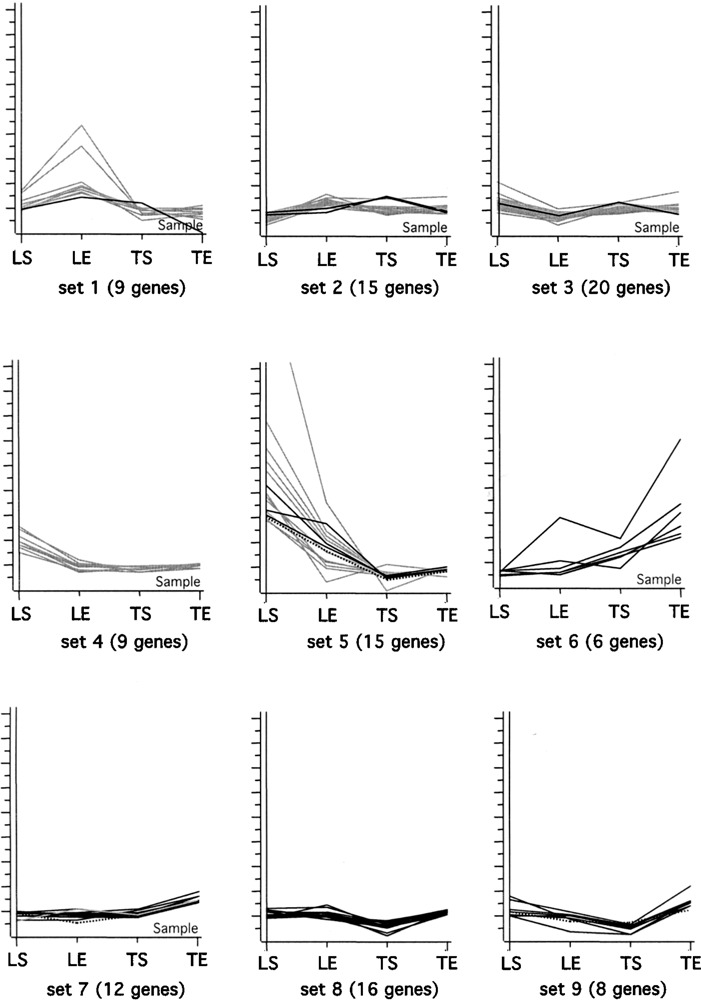
K-Means clustering of 110 probe sets identified as significantly changed by either Dchip or CyberT. Probe sets are clustered into nine groups based upon expression patterns across all conditions. Normalized intensity of expression values is shown on the y-axis. The tissue condition is indicated on the x-axis: from left to right, lumbar sedentary (LS), lumbar exercising (LE), thoracic sedentary (TS), thoracic exercising (TE). Probe sets identified as significantly changed in the lumbar region are in gray, those changed in the thoracic region are in black, and the three probe sets changed in both lumbar and thoracic are broken lines.