
Figure 4.
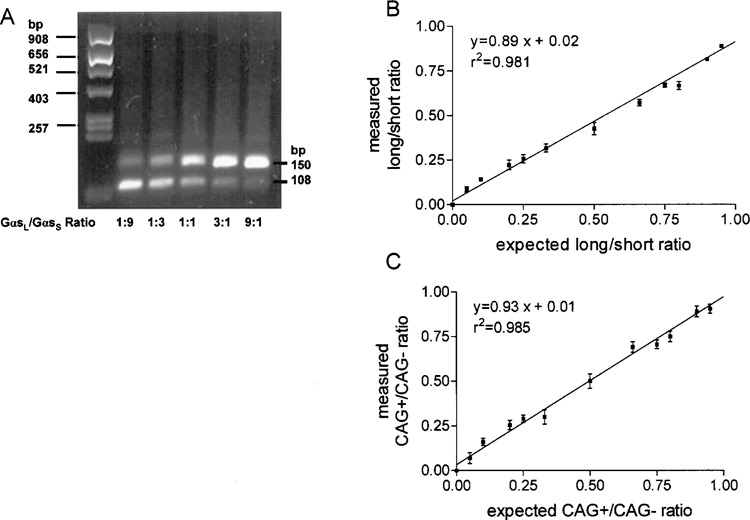
Calibration plot for determination of ratios of Gαs using the Pyrosequencing method. (A) Plasmids containing full-length cDNA of GαsL−CAG and GαsS+CAG were mixed at different ratios in which C5 represents the long form and T6 the short form (Fig. 2). Plasmids were mixed as indicated and PCR was carried out with primers GNAS_RT_Se2 and GNAS_RT_AS2_BT. Products were visualized on a 2.5% agarose gel. Staining of the agarose gel with ethidium bromide resulted in brighter upper bands due to enhanced ethidium bromide intercalation into longer PCR products. (B) Sequencing was carried out using sequencing primer GNAS_Pyr_Seq_spl and peak heights were determined using Pyrosequencing software. Ratios were measured as (C5/G7) + (1 − T6/G7)]/2, with G7 representing peak height for both forms and plotted versus the expected ratios. (C) Plasmids containing full-length cDNA of GαsL−CAG and GαsL+CAG were mixed at different ratios in which C12 represents the +CAG form and G13 the −CAG form (Fig. 3). PCR was carried out with primers GNAS_RT_Se3 and GNAS_RT_AS2_BT. Ratios were measured as [(C12/G15) + (1 − G13/G15)]/2 with G15 representing peak height for both forms and plotted versus the expected ratios. For each data point two independent determinations were performed. A linear relationship between measured and calculated ratios over the whole range of tested ratios could be confirmed. Data are means ± SEM. r 2 = goodness of fit (values can range from 0.0 to 1.0; prediction of x values from y values is possible with a value close to 1.0).