
Figure 5.
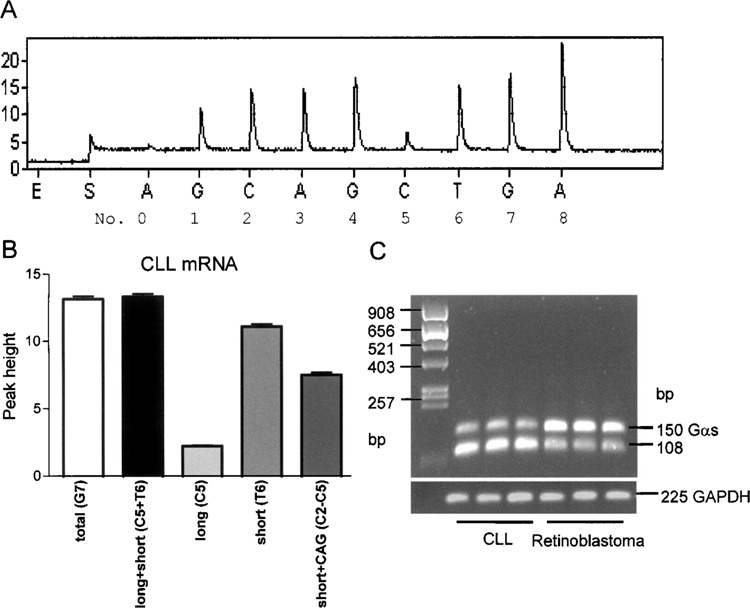
Determination of GαsS/GαsL ratios from blood mononuclear cells and retinoblastoma cells. (A) Representative pyrogram of a CLL sample. PCR from cDNA from blood mononuclear cells was performed using primers GNAS_RT_SE2 and GNAS_RT_AS2_BT. Peak heights were determined using Pyrosequencing software. (B) Peak heights and calculations derived from CLL samples. Accuracy of the method was confirmed by comparing G7 (mean peak height 13.14 ± 0.90), which represents both isoforms and C5 + T6 (13.34 ± 0.85; p = 0.53 t-test), which represent the long and the short variants. (C) Agarose gel from three CLL and three retinoblastoma samples displaying different splicing patterns. Data are means ± SEM.