
Figure 4.
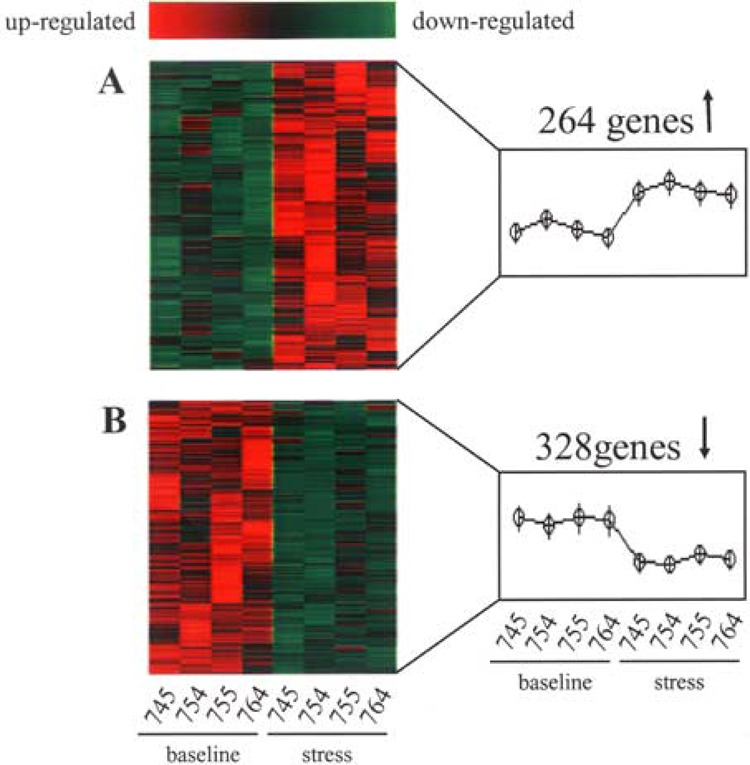
Heat map illustrating stress-sensitive genes in wound site neutrophils. GeneChip microarray analysis was performed using RNA extracted from cells harvested after 22 h of suction blister wounding. For a clear graphic display of stress-sensitive genes, t-test was performed on data from wound site neutrophils of subjects under baseline (745A, 754B, 755B, 764B) or following stress (745B, 754A, 755A, 764A) conditions. The genes that significantly (p < 0.05) changed between the two groups compared were selected and subjected to hierarchial clustering using dChip software as described in Figure 3. Red to green gradation in color represents higher to lower expression signal. (A) Upregulated and (B) downregulated genes in response to stress compared to paired longitudinal baseline samples.