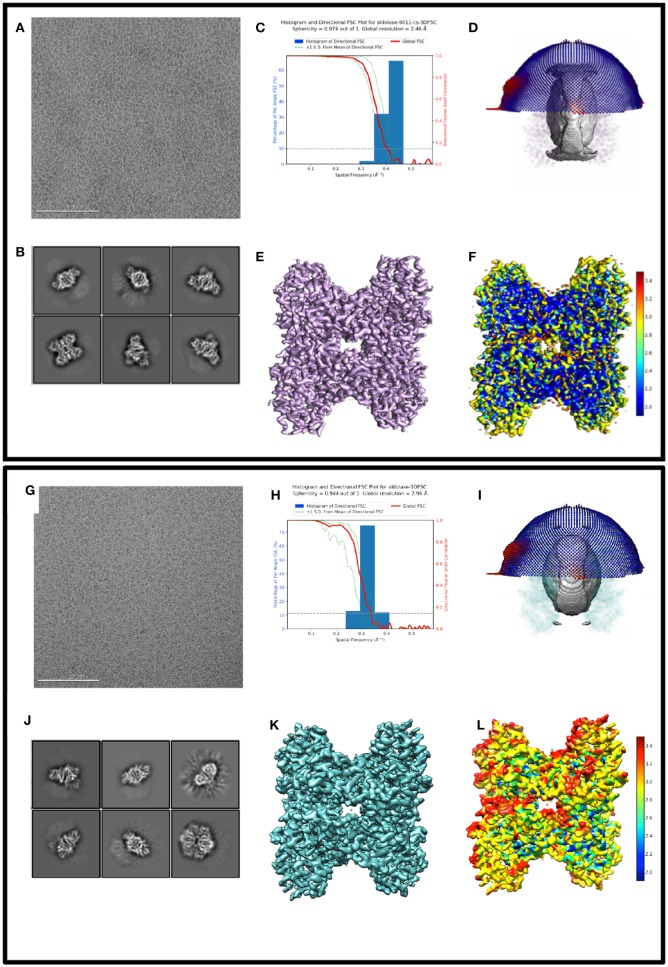
Figure 2.
Comparing 3D reconstructions from thick vs. thin ice 2D and 3D processing results from 17sep21j (dataset #1) and 17nov02c (dataset #2) which yielded maps at 2.5 and 3.0 Å resolution, respectively. Dataset #1 has thinner ice in the raw micrographs, ranging from 10 to 20 nm thick, whereas dataset #2 has thicker ice, ranging from 100 to 250 nm thick. Data to assess include raw micrographs (A,G), 2D classifications (B,J), FSC plots (C,H), sphericity plots (D,I), 3D maps (E,K), and local resolution maps (F,L). Both datasets have about 200,000 particles contributing to the final refinement but dataset #1 is both qualitatively and quantitatively better than dataset #2.

