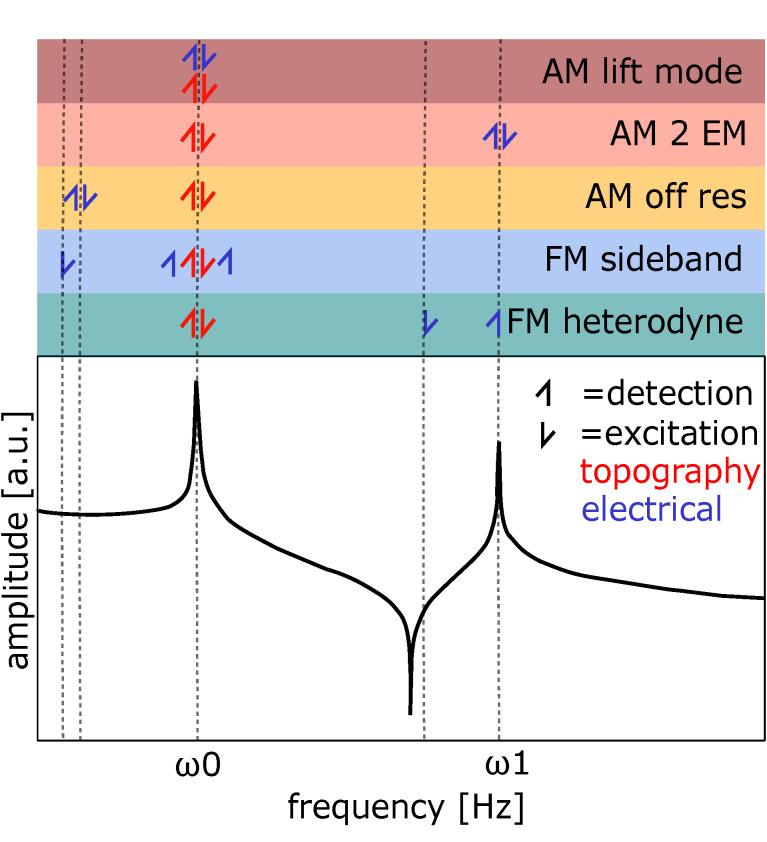
Figure 2.
Overview of excitation and detection frequencies for KPFM methods used in this work. The lower part shows the transfer function of the cantilever, amplitude plotted vs frequency. The upper part shows excitation (arrow upwards) and detection (arrow downwards) for the corresponding methods with the respective frequencies. Red color is used for the topography signal and blue for the electrical excitation and detection. The color code in the upper part corresponds to plots in the results. Representation inspired by [26].

