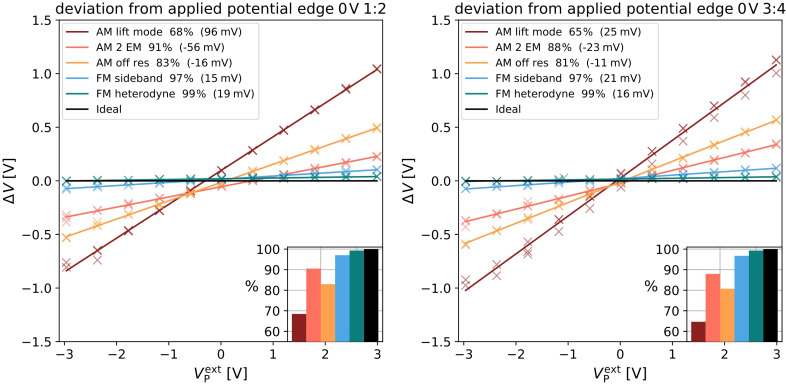
Figure 5.
Comparison of the deviation of the measured potential difference from the applied potential plotted against the applied potential for AM (warm colors) and FM (cool colors), black represents an ideal measurement. Insert in the lower right visualizes the fraction of the potential captured by the respective method. Legend in the upper left shows the offset in brackets. Data shown captured on the electrodes 1/2 (left) and 3/4 (right) of the electrode structure without an additional electrostatic force.

