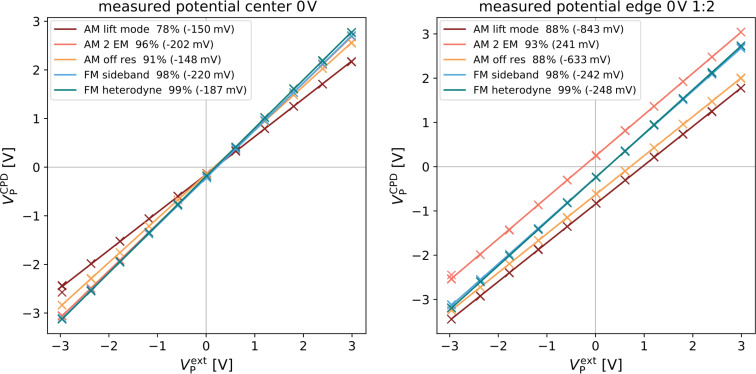
Figure 7.
Comparison of the absolute measured potential plotted against the applied potential for AM (warm colors) and FM (cool colors). Legend in the upper left shows the measured CPD at 0 V applied voltage in brackets. Data shown captured in the middle of the electrode structure (left) and on the outer most electrodes (1/2) (right) without an additional electrostatic force.

