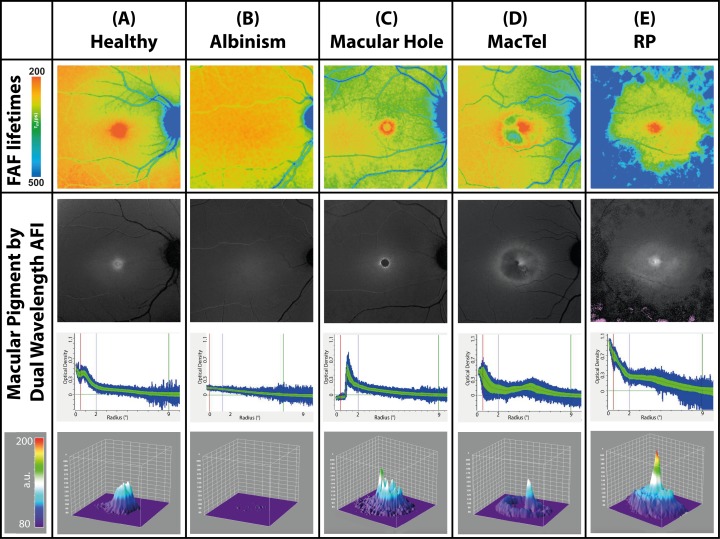
Figure 1.
Mean FAF lifetimes of the short spectral channel (SSC: 498–560 nm; top row) and dual wavelength AFI-MP images in a healthy eye and different retinal diseases (bottom three rows). Row 2: En face image of macular pigment distributions obtained by dual wavelength AFI. Row 3: Decremental slope of MP decline as a function of distance from foveal center. Row 4: Three-dimensional projection of MP. Only the MacTel patient shown in this figure was on supplementation (10 mg zeaxanthin daily).

