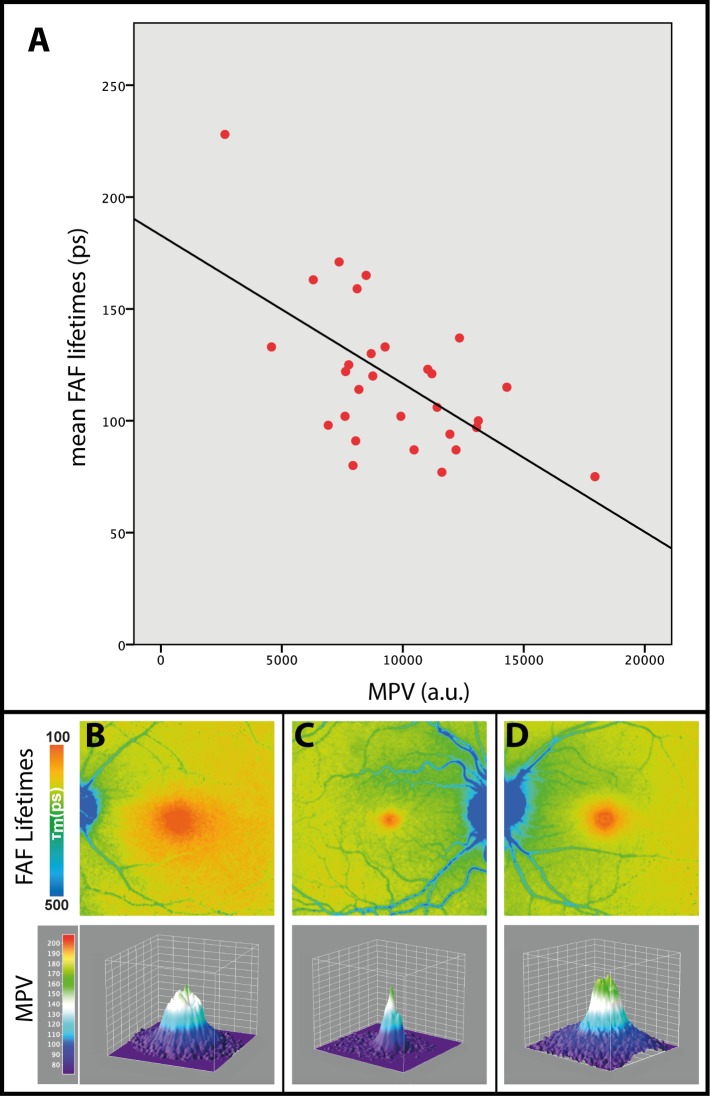
Figure 2.
Pearson correlation of mean FAF lifetimes within the short spectral channel (498–560 nm; SSC) with MPV: r.0608, P < 0.001 (A) as well as three different MP distribution patterns in three healthy subjects: B, broad; C, cone; and D, ring-like. En face FAF lifetime images as well as three-dimensional projection of MPV are shown.

