Figure 2.
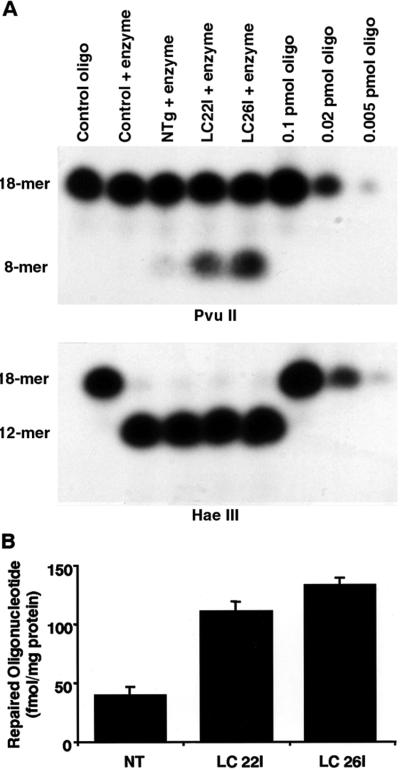
MGMT activity assays. (A) Results from a single MGMT assay by using extracts prepared from liver. (Upper) The amount of repaired oligonucleotide as an 8-mer band. (Lower) The efficiency of cutting by a control restriction endonuclease, HaeIII. (B) Means with standard error shown for each group. n = 5 animals for each line of mice. NT = nontransgenic.

