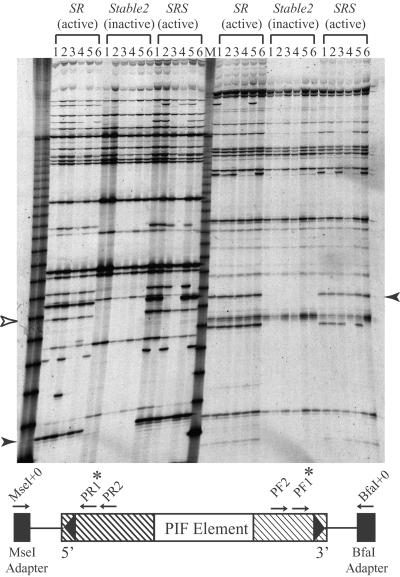
Figure 3.
Transposon display (TD) analysis of a population segregating for PIF activity. Only a subset of the population analyzed by TD is shown. PIF TD was carried out from both the 5′ end (left half of gel) and the 3′ end (right half of gel). Arrowheads indicate PCR products that cosegregate with activity. Open arrowhead indicates PCR products that did not cosegregate with activity in other plants (not shown). SR, plants heterozygous for the autonomous PIF element; Stable 2, plants without PIF activity; SRS, PIF-active plants from the cross between SR and Stable 2 (see Materials and Methods for details); M, 30- to 330-bp molecular weight marker. A schematic representation indicating the positions of the PCR primers is also shown. Arrows represent PCR primers and stars indicate primers labeled with 33P; black rectangles represent BfaI or MseI adapters and hatched rectangles represent terminal regions conserved in all sequenced PIF elements.

