. 2018 May 17;9(24):5427–5434. doi: 10.1039/c8sc00490k

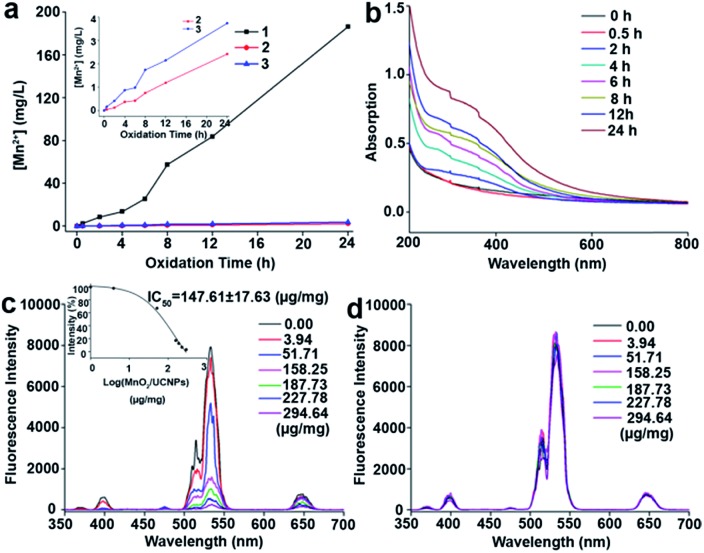
Fig. 5. (a) ICP-OES results of the oxidized UCNPs at different oxidation times. (1) Experimental group, (2) control group 1, and (3) control group 2. (Inset) Enlarged view of the ICP-OES results of control groups 1 and 2. (b) UV-vis absorption spectra of the oxidized UCNPs at different oxidation times in the experimental group. (c) Fluorescence response of the oxidized UCNPs at different MnO2/UCNP concentration ratios (0–294.64 μg mg–1). (Inset) Plot of normalized fluorescence intensity (%) at 533 nm versus the log[MnO2/UCNPs]. The spectra were recorded by excitation with a 980 nm laser at a current density of 2 W cm–2. (d) Fluorescence recovery response of the samples in (c) after adding 10 mM GSH.

Fig. 5