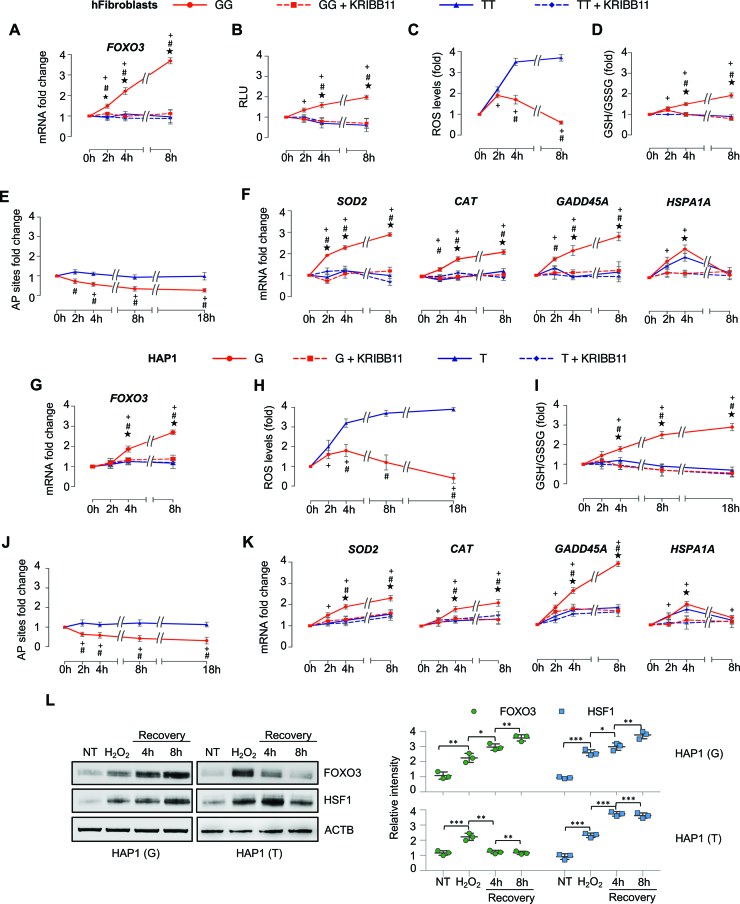
Figure 5.
The rs2802292 minor G-allele has a key role in the stress resistance phenotype of human cells. (A–F) Experiments performed on human primary dermal fibroblasts homozygous for the rs2802292 G-allele (GG, n = 3) or for the rs2802292 T-allele (TT, n = 3) treated with hydrogen peroxide (1 h H2O2, 100 μM) in the presence (where indicated) or absence of an HSF1 inhibitor (KRIBB11, 10 μM). Cells were collected and analyzed at the indicated time points during recovery. (A) Expression levels of FOXO3 as measured by qPCR. (B) Evaluation of FOXO3-dependent transcription by transfection of a FOXO3 responsive vector (FHRE-Luc). Data were obtained by a luciferase reporter assay. (C) Assays performed to measure intracellular ROS levels. (D) Cellular glutathione assay to measure oxidative stress response. The GSH/GSSG ratio indicates the redox status of the cells and is used as a marker for oxidative stress. (E) DNA damage quantification assay to measure the level of DNA lesion and repair. AP sites were used as an indicator of DNA damage. (F) Expression levels of FOXO3 target genes involved in stress resistance (SOD2, CAT, GADD45A, HSPA1A) as measured by qPCR. (G–L) Experiments performed on HAP1 (T, n = 3) and HAP1 (G, n = 3) cells treated with hydrogen peroxide (1 h H2O2, 100 μM) in the presence (where indicated) or absence of an HSF1 inhibitor (KRIBB11, 10 μM). Cells were collected and analyzed at the indicated time points during recovery. (G) Expression levels of FOXO3 as measured by qPCR. (H) Assays performed to measure intracellular ROS levels. (I) Cellular glutathione assay to measure oxidative stress response. (J) DNA damage quantification assay to measure the level of DNA lesion and repair. (K) Expression levels of FOXO3 target genes involved in stress resistance (SOD2, CAT, GADD45A, HSPA1A) as measured by qPCR. (L) Immunoblot analysis (left panel) and densitometric analysis after normalization against the loading control (right panel) of FOXO3 and HSF1 protein expression levels in HAP1 (T) and HAP1 (G) cells at the indicated time points during recovery from treatment with hydrogen peroxide (1 h H2O2, 100 μM). All experiments were repeated three to six times. P-values were derived from t-tests: ★P ≤ 0.05: GG relative to GG+KRIBB11. #P≤ 0.05: GG relative to TT. +P ≤ 0.05: GG relative to 0 h time point. *P ≤ 0.05; **P ≤ 0.005; ***P ≤ 0.001.

