Figure 1.
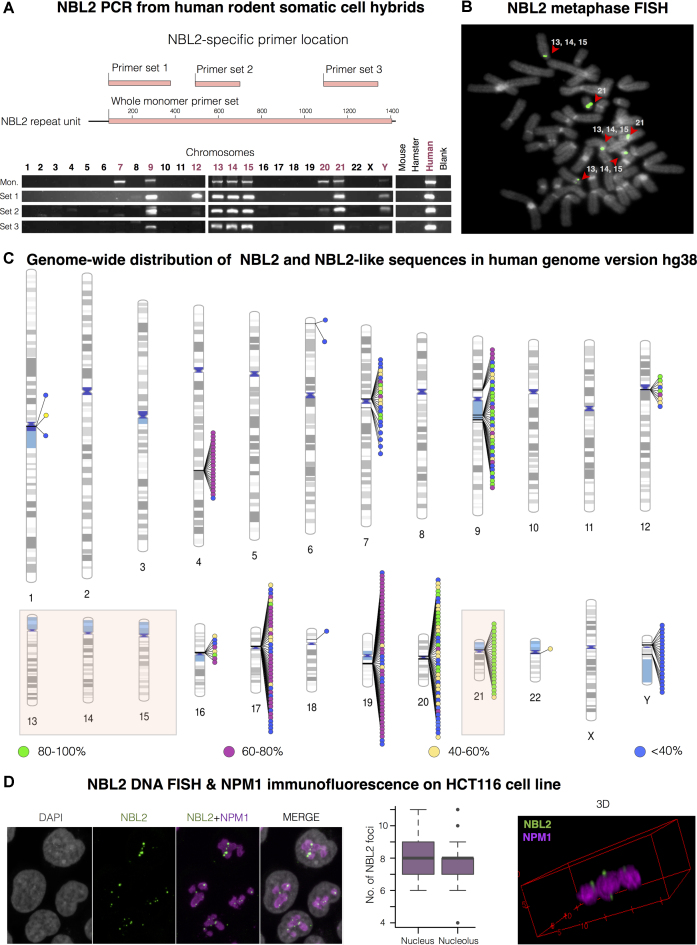
NBL2 distribution in the human genome. (A) NBL2 PCR analysis on DNA from human-rodent somatic cell hybrids containing a single human chromosome isolated in a rodent background. Top: in pink are represented the regions amplified by four NBL2 specific primer sets located across the repeat unit. Bottom: PCR products of each primer set from genomic DNA of somatic cell hybrids containing the indicated human chromosome. (B) NBL2 DNA FISH on metaphase spreads from leukocytes of a healthy donor (46XX). Hybridization signals were detected close to the centromeres in the short arms of acrocentric chromosomes 13, 14, 15 and 21 (n = 30). NBL2 in green, DAPI in grey. (C) Ideogram showing genome-wide distribution of NBL2 repeats in the human genome version hg38. 301 hits were color-grouped according to their similarity to NBL2 consensus sequence. Acrocentric chromosomes positive for NBL2 by PCR (A) and FISH (B) are highlighted by a colored box. (D) NBL2 DNA FISH (green) and NPM1 immunofluorescence (magenta) on interphase nuclei (grey) of HCT116 cell line. 3D view (on the right) shows NBL2 repeats from acrocentric chromosomes located in the perinucleolar region. On average, each nucleus contained 8 NBL2 FISH signals, with 92% of detected signals located adjacent to nucleolus (n = 30 nuclei).

