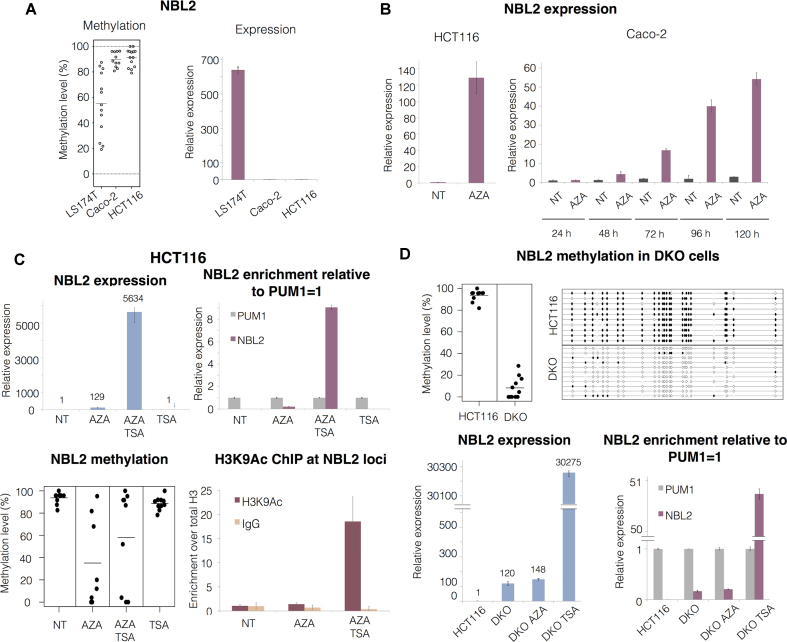
Figure 2.
DNA methylation and histone deacetylation maintain NBL2 repressed. (A) Left: NBL2 methylation assessed by bisulfite sequencing in 3 CRC cell lines. Right: relative NBL2 expression analyzed by RT qPCR in CRC cell lines. (B) Left: NBL2 expression analyzed by RT qPCR in HCT116 cell line untreated (NT) and treated with AZA for 72h. Right: NBL2 expression analyzed by RT qPCR in Caco-2 cell line untreated (NT) and treated with AZA in a 5-day time course experiment. (C) Upper left: NBL2 expression assessed by RT qPCR in HCT116 cell line untreated (NT), treated with AZA, treated with AZA followed by TSA, and treated with TSA only. Upper right: relative abundance of NBL2 transcript compared to PUM1 levels (assigned as 1 in each sample) within each treatment group. Lower left: NBL2 methylation assessed by bisulfite sequencing in each treatment group. Each dot represents the average methylation of one NBL2 bisulfite converted sequence. Lower right: H3K9ac chromatin immunoprecipitation at NBL2 loci. Enrichment levels were normalized with H3 total levels at NBL2 loci. (D) Top left: NBL2 methylation assessed by bisulfite sequencing in HCT116 and DKO. Each dot represents the average methylation of one NBL2 bisulfite converted sequence. Top right: NBL2 methylation in HCT116 and DKO represented by a lollipop graph. Each line represents the internal region of 1 bisulfite converted NBL2 cloned DNA molecule. White and black circles: unmethylated and methylated CpGs, respectively. Lower left: RT qPCR of NBL2 in HCT116 untreated, DKO untreated, DKO treated with AZA and DKO treated with TSA. Lower right: relative abundance of NBL2 transcripts compared to PUM1 levels (assigned as 1 in each sample). All qPCRs show relative levels obtained using comparative Ct method and normalized with PUM1.

