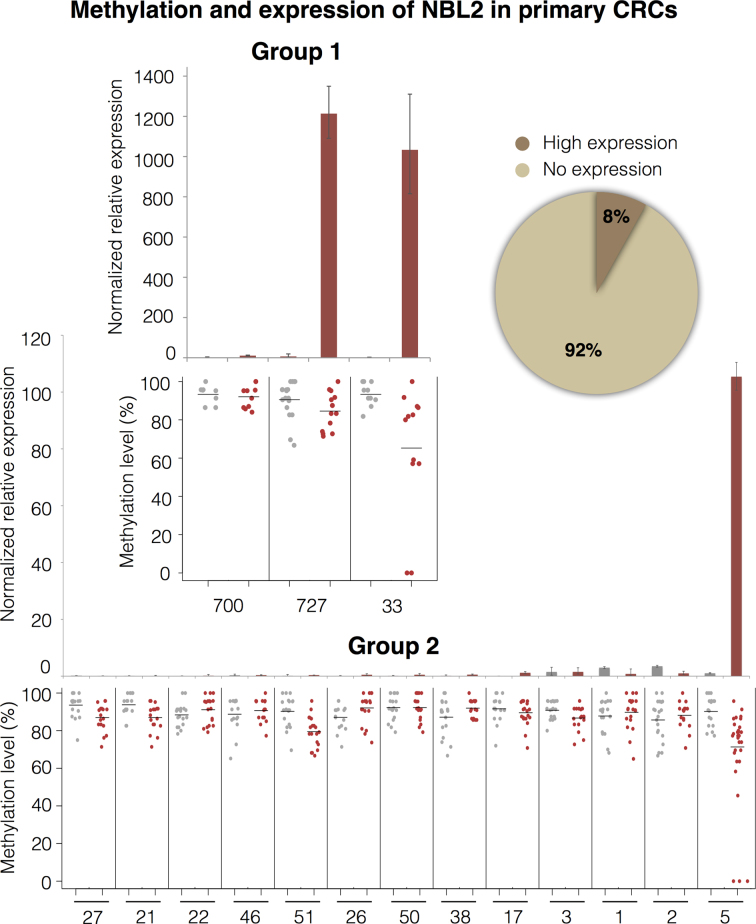
Figure 3.
NBL2 somatic DNA hypomethylation predisposes for NBL2 overexpression in CRC. NBL2 expression analyzed in 2 CRC groups. Group 1 (24 tumor and matching normal tissue samples) analyzed for NBL2 expression by RT qPCR (top) and methylation by bisulfite sequencing (bottom). Three representative cases are shown: two cases (727 and 33) with NBL2 overexpression in the tumor and one case (700) with no detectable NBL2 expression. Group 2 (13 tumor and matching normal tissue samples) analyzed for NBL2 expression by RT qPCR (top) and NBL2 DNA methylation by bisulfite sequencing (bottom). In methylation graphs each dot represents average methylation of an internal region of 1 NBL2 bisulfite converted sequence. Red dots for tumor, grey dots for normal. Pie chart shows the percentage of patients expressing NBL2 considering both groups (n = 37). Statistical analysis was not performed due to low number of samples.

