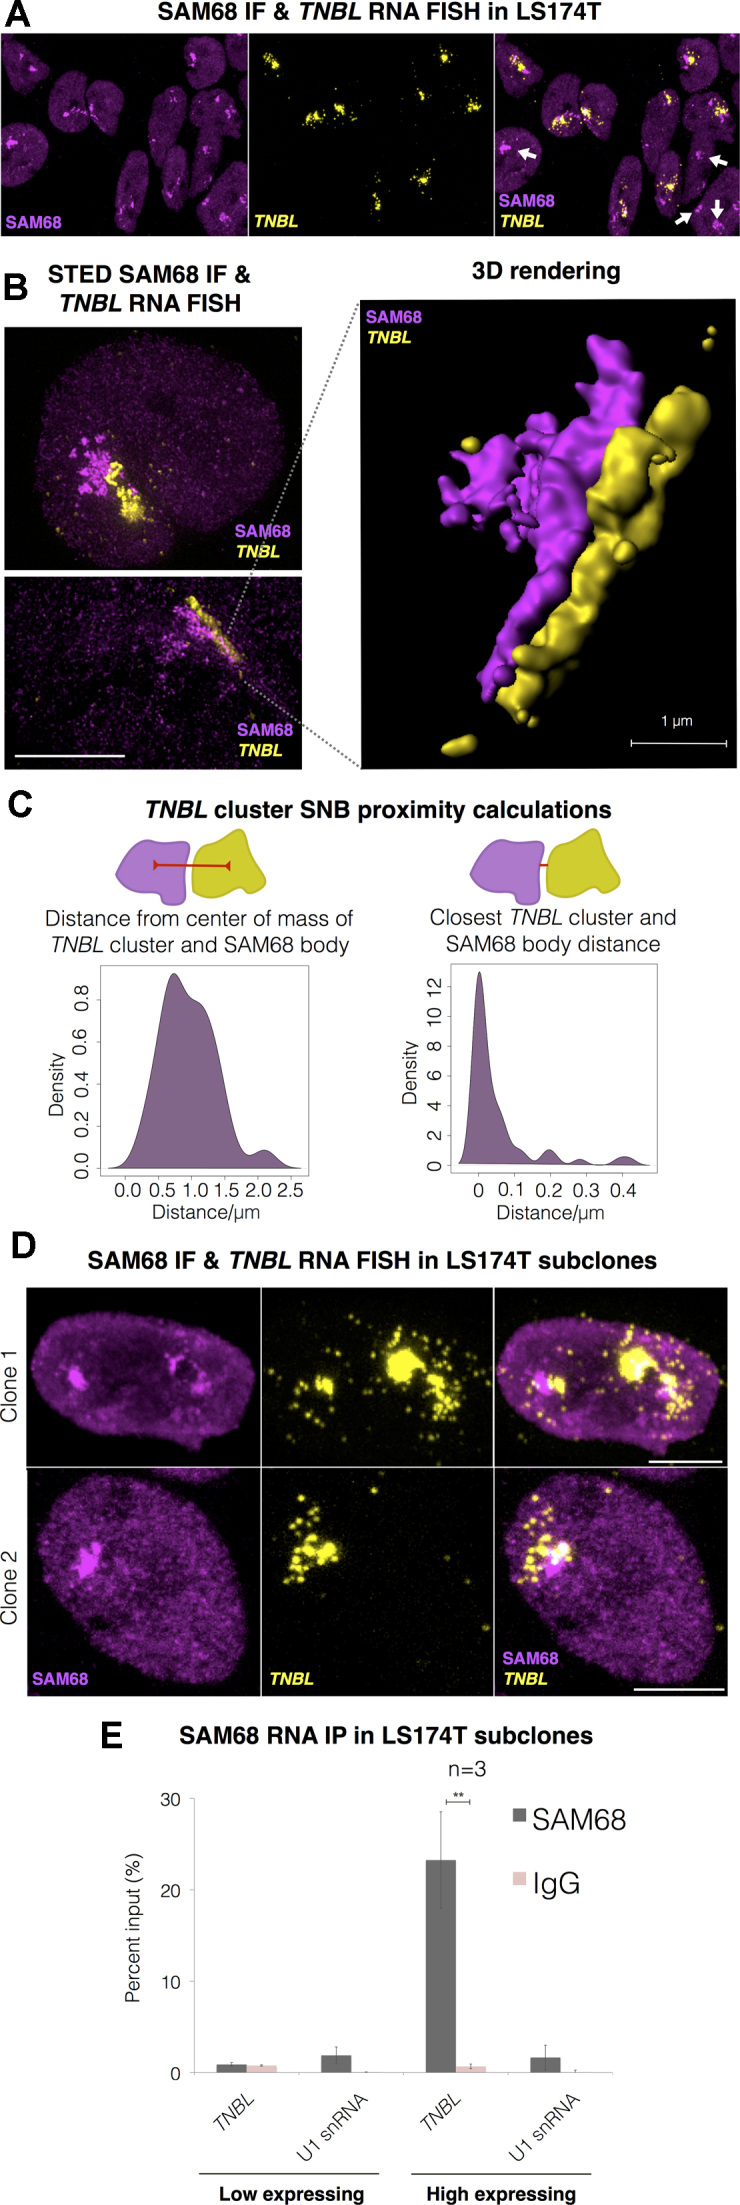
Figure 6.

TNBL forms aggregates adjacent to SAM68 perinucleolar body (SNB). (A) Maximum intensity projection of SAM68 IF (magenta) and TNBL RNA FISH (yellow) confocal imaging in LS174T. SNBs (intense magenta) are located adjacent to TNBL clusters. White arrows: SNBs that do not co-localize with TNBL. (B) Left: SAM68 IF and TNBL RNA FISH STED images, top: both structures in an irregular round form, bottom: elongated form. Scale bar, 5 μm. Right: 3D rendering of the bottom left image showing SNB and TNBL aggregate in a lateral interaction through the entire length of the structures. Scale bar, 1 μm. (C) Proximity calculations between SNB and TNBL cluster in STED imaging (n = 54). Left: distances between SNB and TNBL clusters centers of mass. Right: closest exterior distances between SNB and TNBL clusters, median value 0 μm and maximum measured distance at 0.42 μm. (D) Maximum intensity projection of TNBL RNA FISH (yellow) and SAM68 IF confocal imaging in TNBL high expressing LS174T clones. Scale bar, 5 μm. (E) SAM68 UV crosslink RNA IP in high and low TNBL expressing LS174T clones. TNBL and negative control U1 snRNA were monitored by RT qPCR. Error bars indicate s.d., n = 3, **P ≤ 0.01, as evaluated by unpaired t-test vs. IgG.
